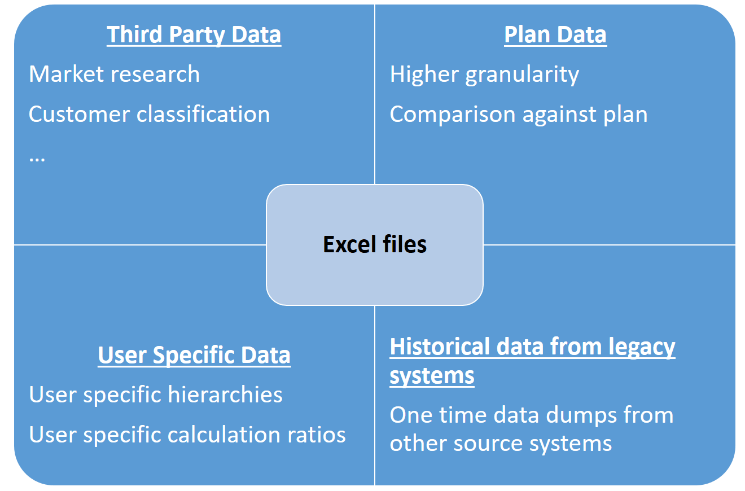
Microsoft Excel is the most popular and dominant data analysis tool used by organizations today. Consequently, there is a huge demand from business users to not only download and analyze enterprise data offline but also prepare, provision and integrate excel data with enterprise BI tools and platforms. Needs of the latter type can be broadly classified into three categories:
- To integrate plan data into reports – where the plan data exists in an excel file and not in an enterprise system like SCM or BPC but in an excel sheet with the user who has all the macros and logic required to churn out a plan .
- To integrate third party data like market research information, customer classification etc.
- To have custom classifications or hierarchies that the user wants to incorporate into their data sets – like division specific hierarchies or division specific customer groups
- To integrate data exported from other enterprise / legacy systems
Using Microsoft Excel in such scenarios explained above has the following benefits too:
- Visualize information faster before commissioning projects to consume/integrate this data with EDW
- Get the developer and business in alignment with regard to complexities of data acquisition, data wrangling etc before any project is started. This helps in building out what the user wants as opposed to building a tank when all you wanted was a pea shooter.
For enterprises that leverage SAP Business Intelligence, users can visualize, report and publish excel data through self service tools such as SAP Lumira, or leverage one of the following options:
- Build BW Workspaces that can hold excel sheets; this can be further consumed by tools like SAP Design Studio
- Build SAP BusinessObjects universe on top of the excel file
- Use add-ons such as Excel component from VBX Product Extensions for SAP Design Studio
Considerations for using one of the above methods is outlined below:
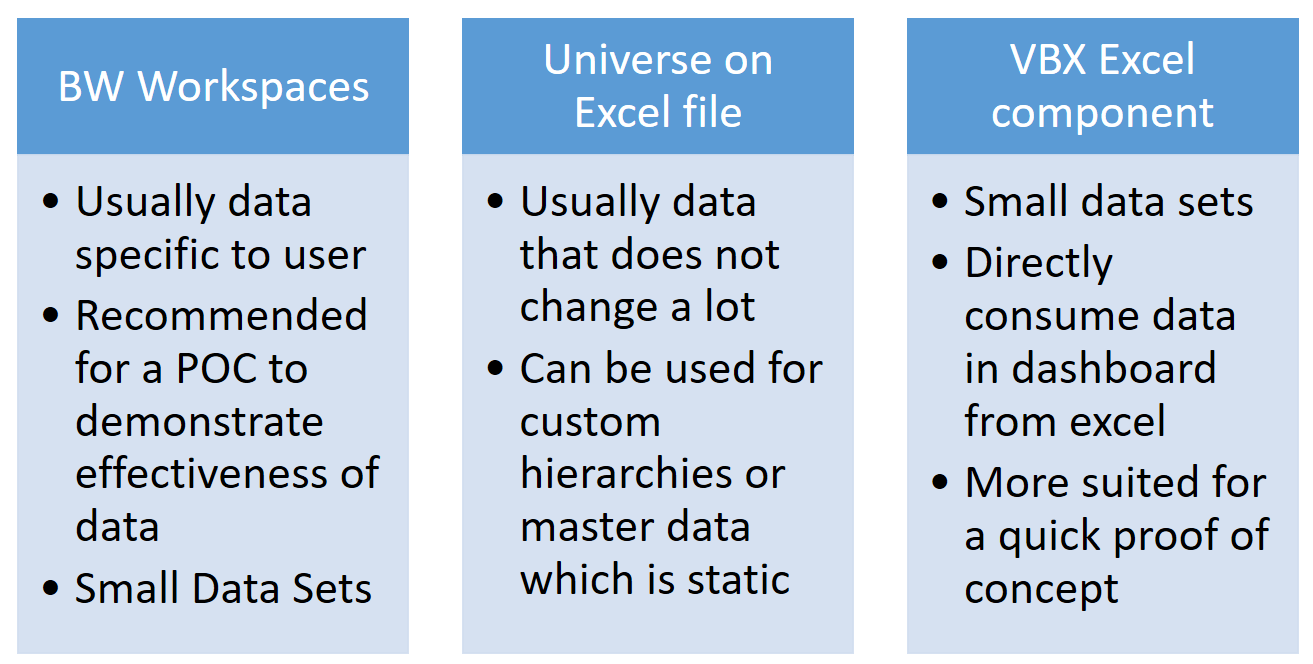
A more detailed comparison of these approaches can be found in my next blog.