This is part of the VBX Geo Mapping Capabilities blog series.
I’m sure you would come across a scenario where you wanted map different routes or wanted to connect various locations on a map. Well you can now do so by using the VBX Flow map in SAP Lumira Designer
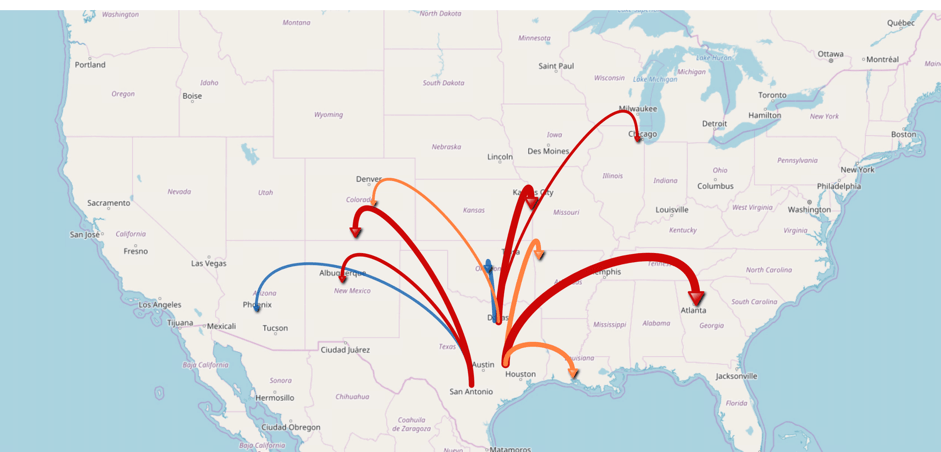
Flow maps in the world of Location analytics are used to show the movement of objects from one location to another by drawing lines between the points. They are a great way to represent the movement of goods, weather phenomena, migration patterns of people across the globe, tracking flight movements etc.
A flow layer can represent both quantitative and qualitative data. You can configure up to two measures, one for line color and another for defining the weight (line thickness).
Let’s consider an example where, a logistics / fulfillment manager of a logistics company would like to monitor the transport routes in his territory and check for any issues causing delay to the freight in transit. With the help of flow layer, one can easily visualize these issues and understand the criticality of these issues by looking at the line color (delay caused by the issue) and count of open issues for each of the routes (thickness of the line).
How to create a flow layers
Following are the 3 simple steps to setup a flow layer in VBX Location Analyzer.
Data
To configure the data for the flow layer you would the following data elements
- Dimension – Origin City Longitude(From_Long) in the Rows
- Dimension – Origin City Latitude(From_Lat) in the Rows
- Dimension – Destination City Longitude(To_Long) in the Rows
- Dimension – Destination City Latitude(To_Lat) in the Rows
- Measure – Delay(mins) used for Color
- Measure – Count of issues used for Size (width of the lines)
Following is a snippet of the data used for our example. Note that we have included some extra information which we will display as part of our tooltip

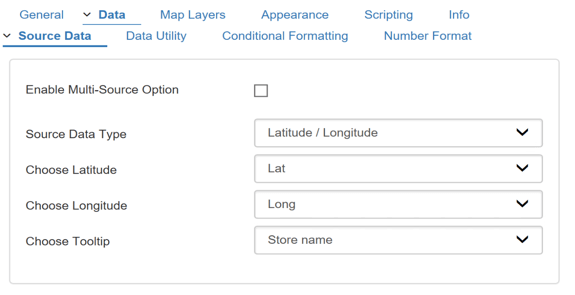
Step 1: Once the data is ready, let’s configure the data with the location analyzer. Drag the location analyzer to the canvas and navigate to the data tab to configure the following fields
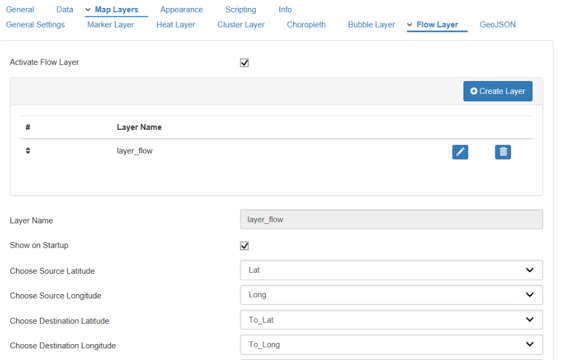
Step2: Next let’s setup the flow layer
- Give a name to the layer
- Configure the source latitude and longitude
- Configure the destination latitude and longitude
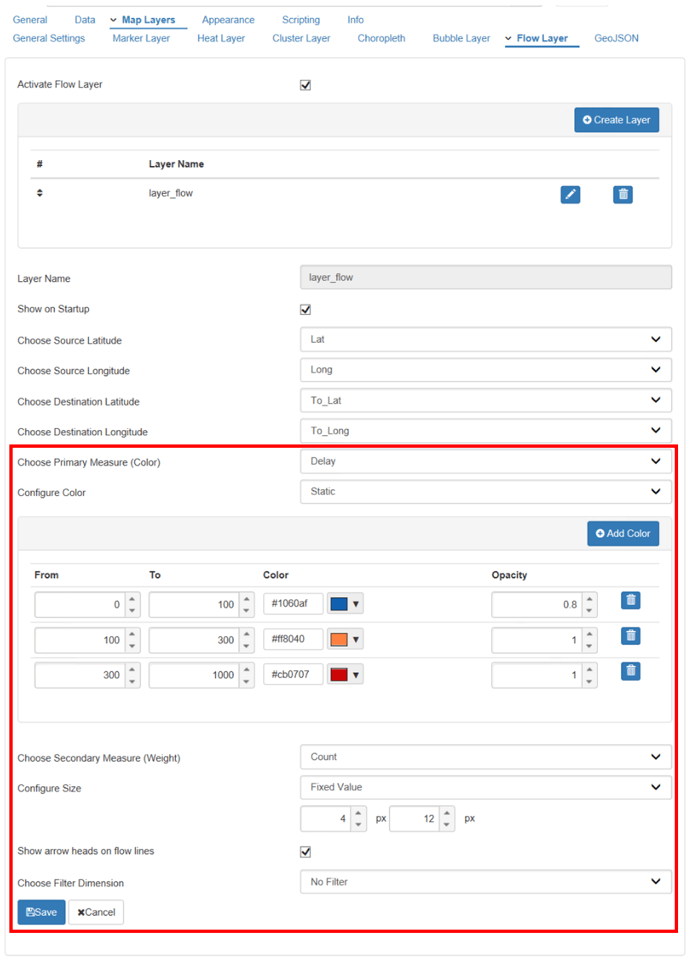
Step3: Lastly, we need to assign color and size to our flow layer
- Select the measure for color – delay caused in our example
- Configure color – Following are the options to setup the color
- Color Spectrum – Choose colors from prebuild color templates and define the number of buckets
- Static – Define colors based on fixed values e.g. as seen in the image below
- Dynamic – Define colors based on percentage values e.g. values beyond 60% – red
- Select the measure for line weight – Count of trains affected in our example
- Configure the size parameter – you can configure either in pixels or percentages
- Display arrow head – for our use case we wouldn’t need it
Finally, our Flow Layer is ready!
With the help of flow layer map, one can quickly visualize the delay caused on each of the routes along with the number of trains affected due to the delay on each of the routes.
You can also make use of tooltip formatting capabilities to understand the cause of the issue, whether it’s a maintained related issue or due to some other reasons.

Gain valuable insights using your own spatial data and VBX Geo Mapping capabilities for SAP Lumira Designer.
Click here to download a FREE 15-day trial of VBX for SAP BusinessObjects Design Studio.
