For latest enhancements please refer – VBX Advance Table for SAP Lumira Designer
One of the common feedback we received from our customers about the crosstab in SAP Business Objects Design Studio was that it was “complicated” to format the standard crosstab and that they were missing the typical “Excel like” sorting option. After we heard the feedback and discussed the details with a few customers, we decided that we are going to develop our own Advanced Table component and in the next few sections, I would like to provide a short introduction to a few highlight of this new component.
Simple Table
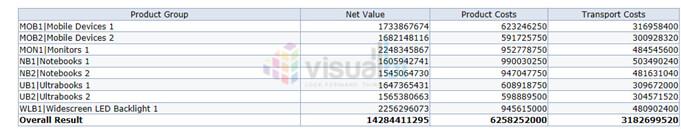
We will start with a very simple table definition based on a data source as shown in Figure 1.
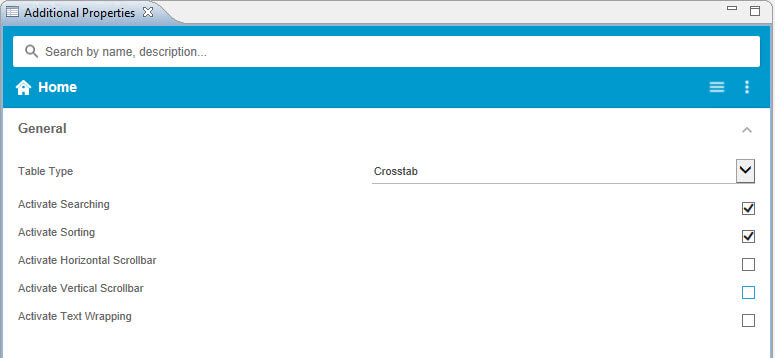
Now looking at the Additional Properties of our Advanced Table, we can activate the search option and the sorting option.
In this example, we have three measures and one dimension.
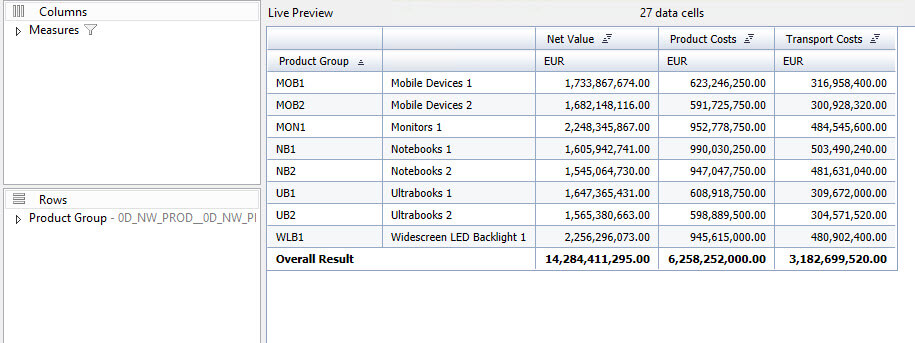
So our advanced table component in SAP Business Objects Design Studio (Design Studio) will look like shown in Figure 2.
Now looking at the Additional Properties of our Advanced Table, we can activate the search option and the sorting option.
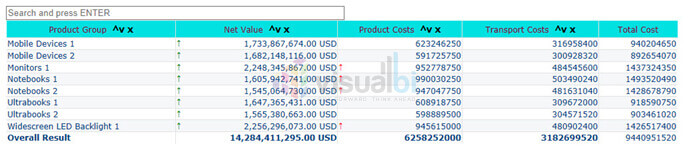
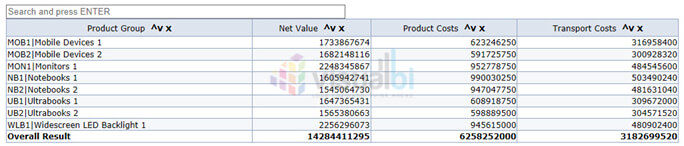
After we activated these options, our table automatically is offering the new functionality (see Figure 4) and we can now sort each column independent of each other and we are able to search in the complete table.
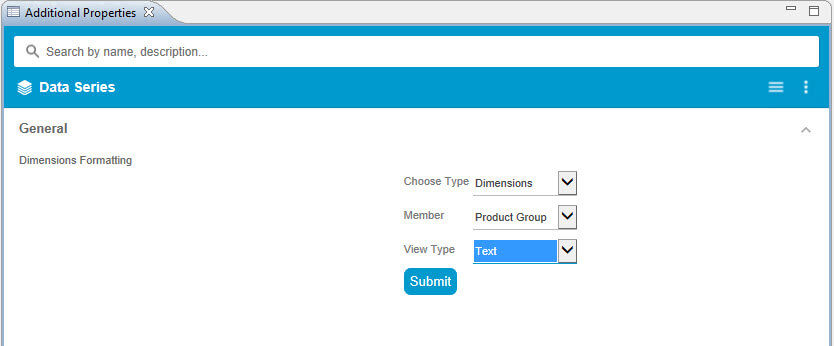
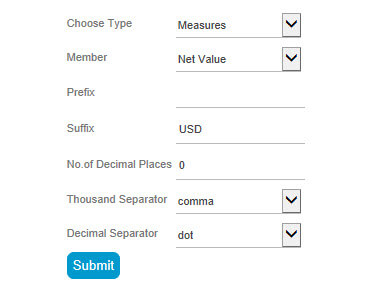
Now looking at the Data Series category of the Additional Properties, you can see that you have the option to define the format of each column.
You can decide if you would like to show the dimension Product Group with the key, or text, or both – as shown in Figure 5 and you can define the format of the measures as shown in Figure 6.
Now let’s move on to a more important feature – the dynamic alerting capability. SAP Design Studio does support the Exceptions from SAP NetWeaver BW, but what if you would like to highlight data coming from SAP HANA or from a Universe ? That is why our Advanced Table allows you do define the alerting directly as part of your dashboarding project.
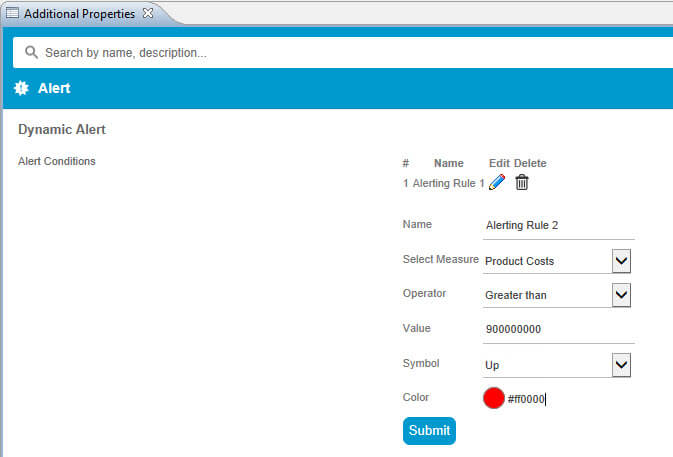
Figure 7 shows, for example, the details of an alerting condition for measure Product Cost where a red arrow up will be shown in cases where the value is greater than the define comparison value.
You have the option to define alert conditions for each measure in the table and you can setup multiple conditions for each column.
Another great feature of the Advanced Table is the ability to add a simple calculation. In our example, we have two measures: Product Costs, and Transport Costs. If we now wanted to know what the Total Costs are we can quickly add such a calculation to our table.
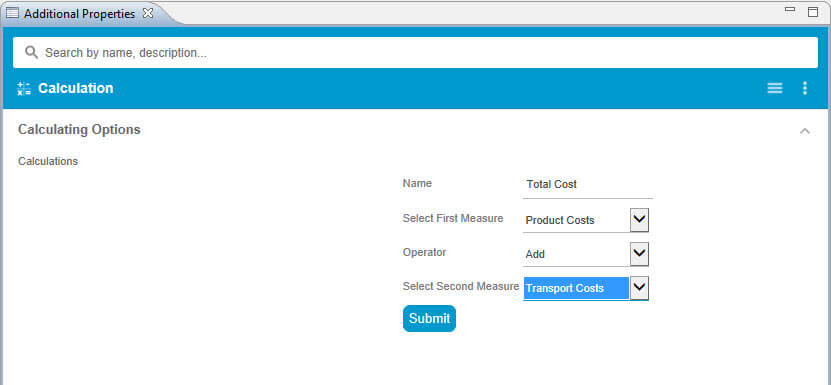
Figure 8 shows the definition of the calculation for the new measure Total Cost. Right now our Advanced Table does support the following operators: Add, Subtract, Divide, and Multiply.
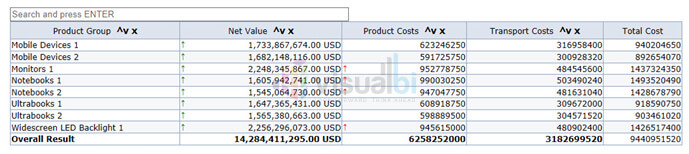
So far we changed the display of the measure Net Value, we changed the display for dimension Product Group, we activated search, we activated the sorting, we added a calculation, and we added alerts – and this is how our table looks like:
Last but not least, we can define the general layout of the table structure itself. In the Additional Properties of the Advanced Table, we have all the different options available – see Figure 10.
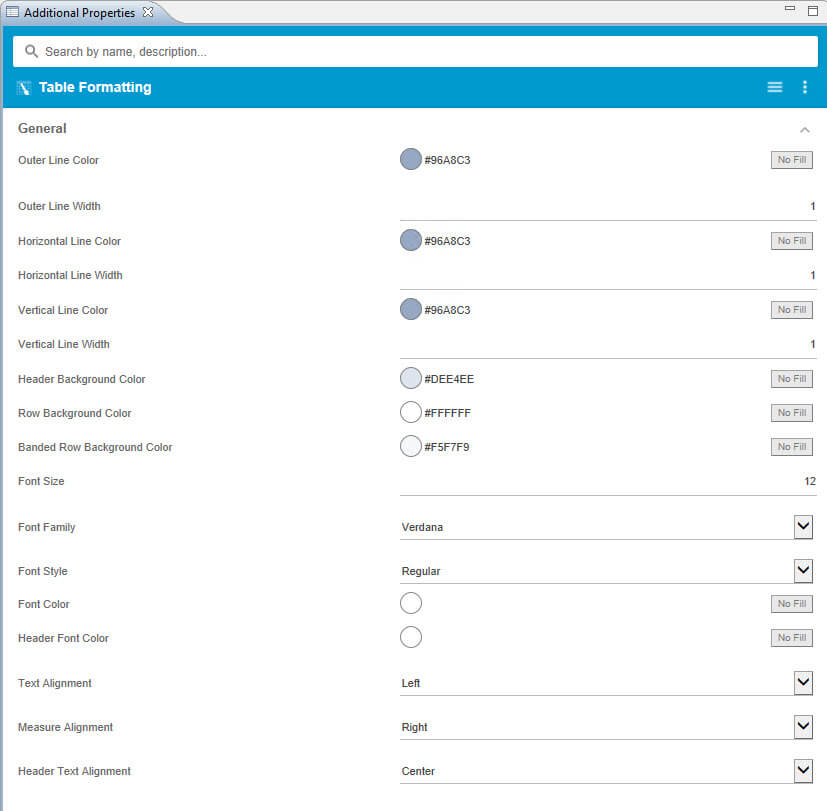
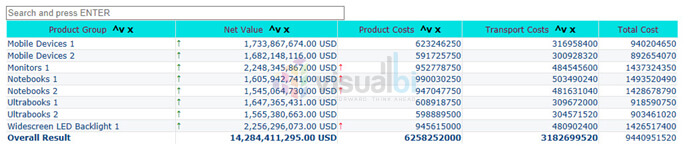
We can use all those settings and quickly change the look and feel of our table without having to worry about CSS classes and having to write CSS code.
I hope that I was able to give you a quick introduction to the Advanced Table component as part of our VBX for SAP Business Objects Design Studio. In case you are interested, you can register for a 30 day Trial on our website and experience the Advanced Table with your own data.