In SAP Lumira Designer dashboards, we have been creating Top/Bottom N condition either in Bex query for BW source or on HANA Views (Ranking node) for HANA. In this blog, we are going to see how to achieve Top/Bottom N Ranking using VBX Charts and eliminate Traditional backend systems:
Note: To achieve this, you would require VBX.
- Create a Lumira Designer Application and insert VBX chart (Let’s say we take Column/Bar chart in our example).
- Drag and drop a VBX Column/Bar chart and map it to a data source.
- Let’s consider for an example, here in our data source we have Stores in rows and Sales in columns. We are trying to look at Top 5 Store Sales.
- Sort the key figure ‘Sales’ in descending order for Top N scenario.
- Open the Chart additional properties and change chart type to Bar.
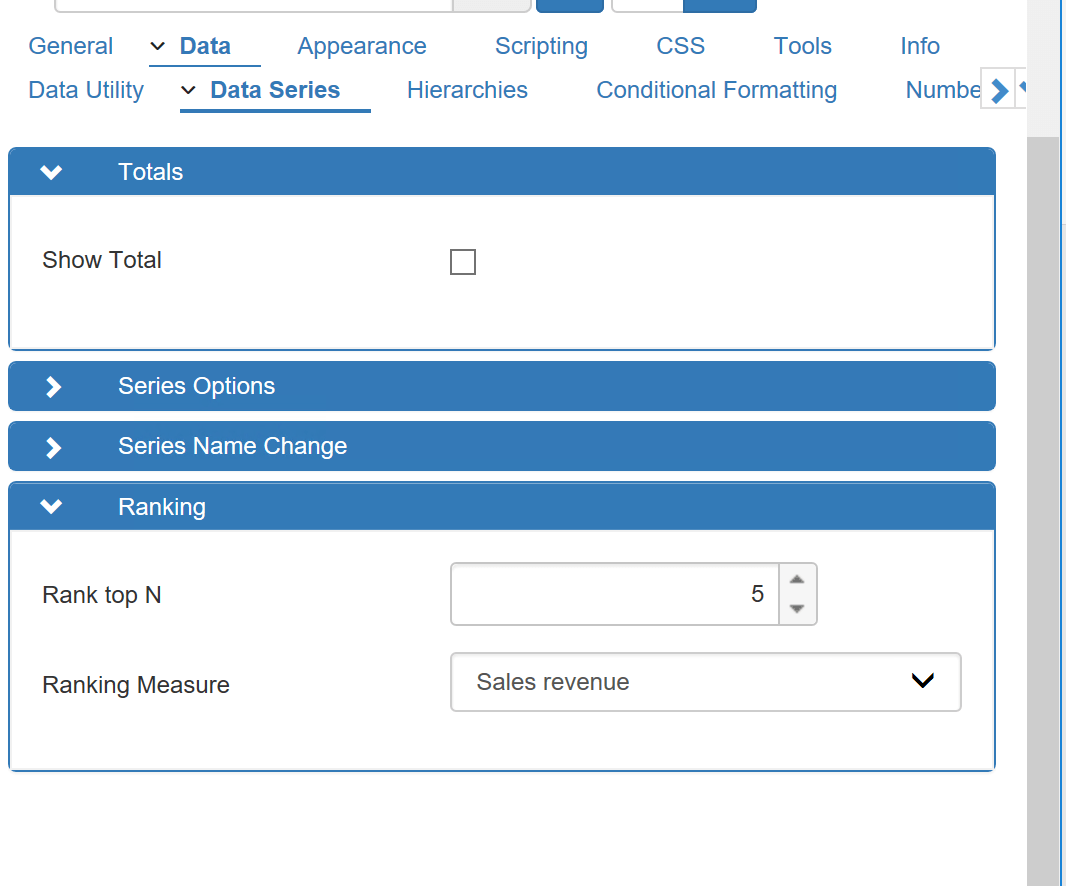
- Go to Data –> Data Series section. Expand ‘Ranking’ box and set value for “Rank Top N”. In our example it is set to 5. Assign the required measure to Ranking Measure field.
- Save the application and run the dashboard. You will notice that chart displays only Top 5 members.
- In case you would like to re-arrange the members in vice versa position, Go to General –>X-Axis–> “Enable Reverse Axis” feature.
- You can also achieve the same thing for Bottom N. The only difference is you have to sort the measure/metric in ascending order. And also, we need to use different chart and data source for showing Top N & Bottom N together.
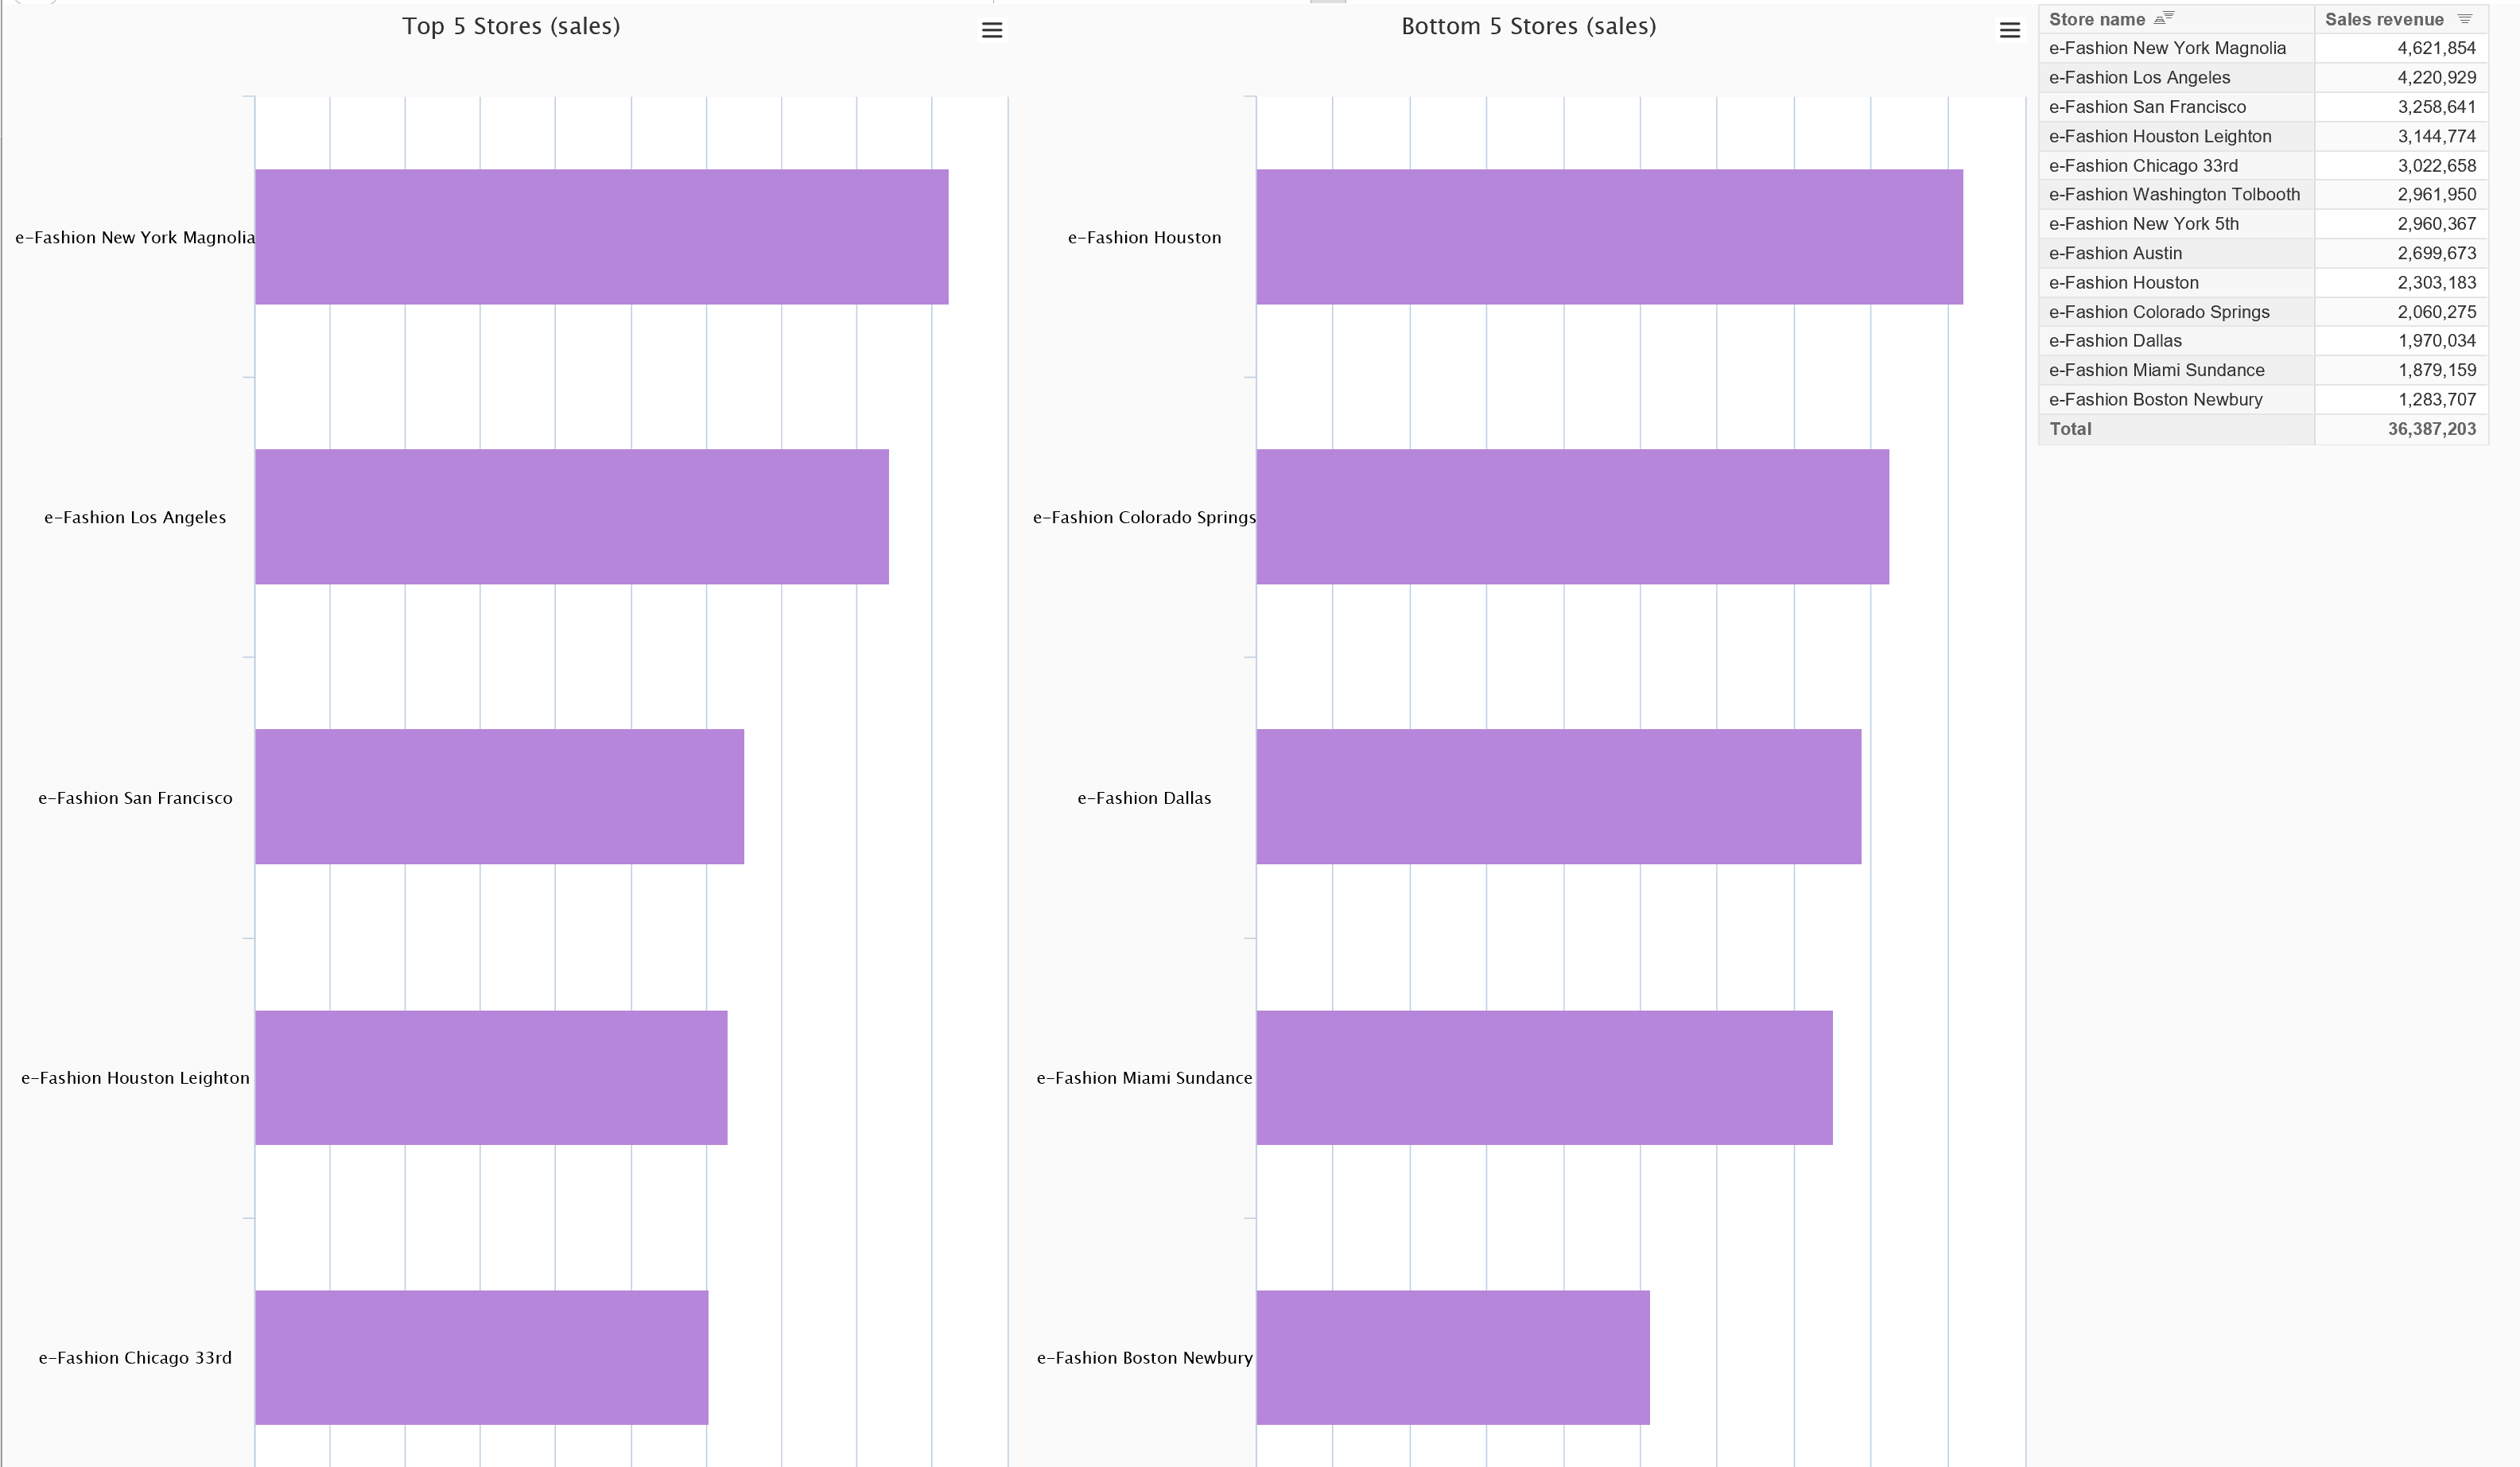
Below example shows output of Top 5 & Bottom 5 Store Sales. On the right, you see table which has list of all stores with respective sales and will be matched.
Know more about VBX Extensions for SAP Lumira designer here.