
We have seen many extensions for SAP Lumira Designer that come with a lot of customization properties. This time we are going to look at two components which can work wonders in Lumira designer and yet, are not used a lot. When we look at the HTML Box and Script Box, the first thing that pops up in our head is that they do not have any specific UI features and also have very few customization properties since they mainly run based on the developer’s input to enhance the UI/UX for business users.
HTML Box:
We can use this extension to create any kind of HTML elements to our desire within the dashboard. The most common use case for the HTML box is creating a label, since Lumira studio label/textbox usually doesn’t provide high-levels of formatting.
Script Box:
This can be used to customize the existing behavior of the elements that are already used within the dashboard.
Usage:
By combining the abilities of these two components, we can create and manipulate any feature that you wish to have on your dashboard. Now, we are going to look at one of the use cases of the same:
We are using a dashboard where the key figures are QTD, YTD and MTD (as shown in the screenshot below). Some dashboard users might get into a confusion as to what QTD, MTD and YTD refer to. So, we need to provide more clarity on what those key figures exactly refer to, in this particular scenario.
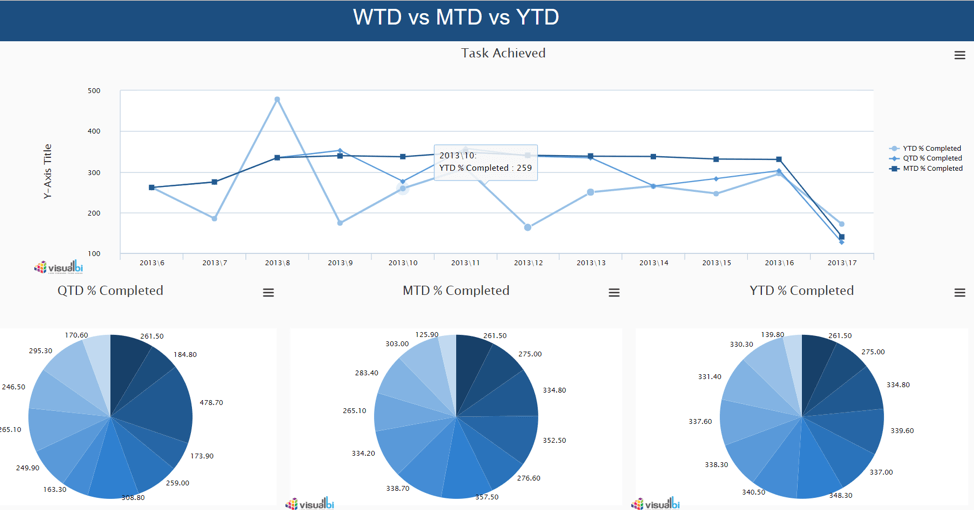
Even though the dashboard looks crisp and clean, it doesn’t provide all the metadata that is needed. We have planned to provide a glossary-index which provides details on those abbreviations. I couldn’t think of any other existing extensions which can satisfy this need of ours. Therefore, we decided to use HTML box here. Also, we need to make sure that the real-estate it consumes be very minimal and at the same time deliver a very elaborate content by giving the right kind of details to the users. For that, we have created this UI using the HTML box.
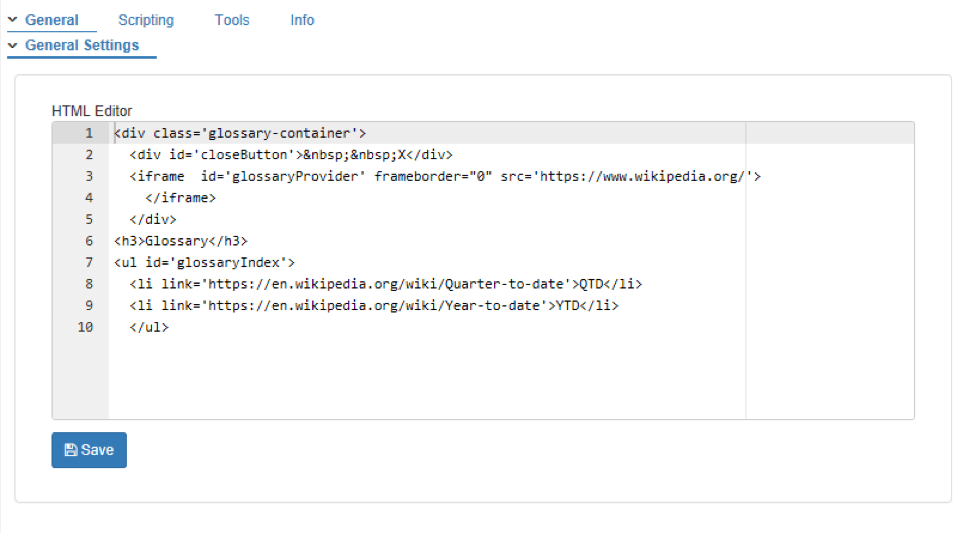
We have added a few lines of HTML code (as shown in the screenshot below). This creates a list with the glossary items and a panel to display the content.
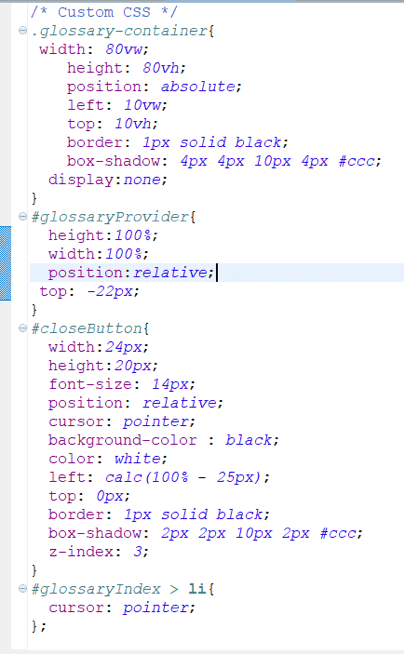
Also, we added a few lines of CSS to improve the aesthetics of the contents within the glossary.
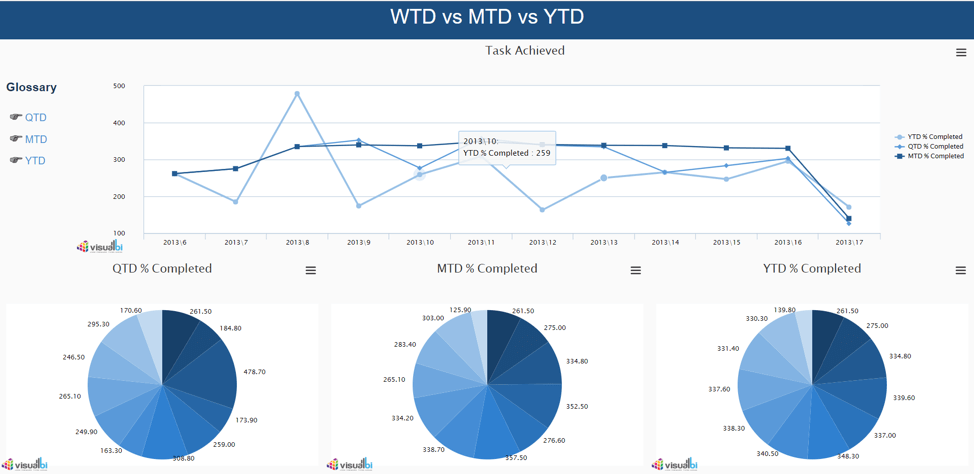
How the dashboard looks after the creation of Glossary with the help of HTML Box:
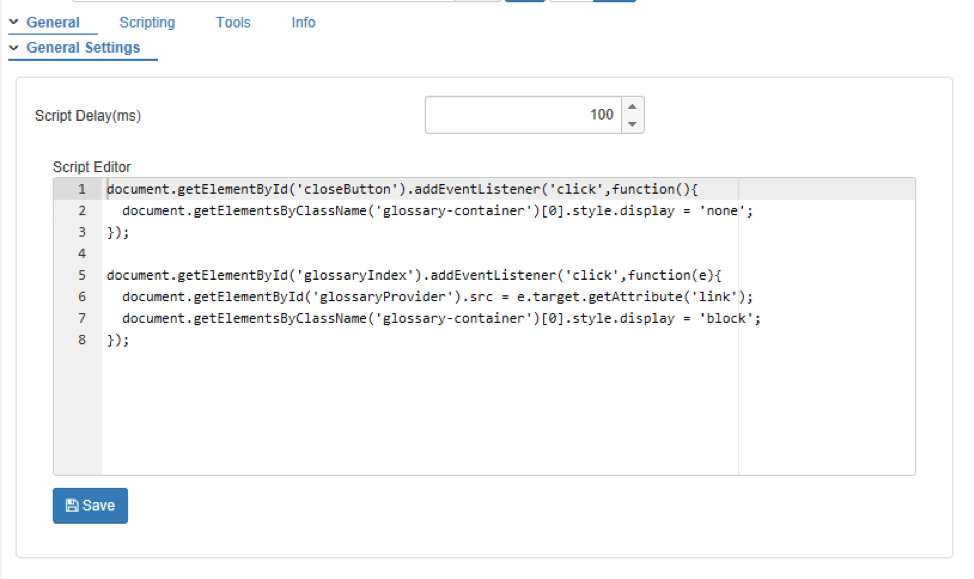
Even after we add the index items the result seems more static than functional. We want the links to take us to the details of the page where the user can find more elaborate details about these Measures. For that, we are using the Script Box. The following lines are added to the script box and the respective links are ready to deliver its purpose.
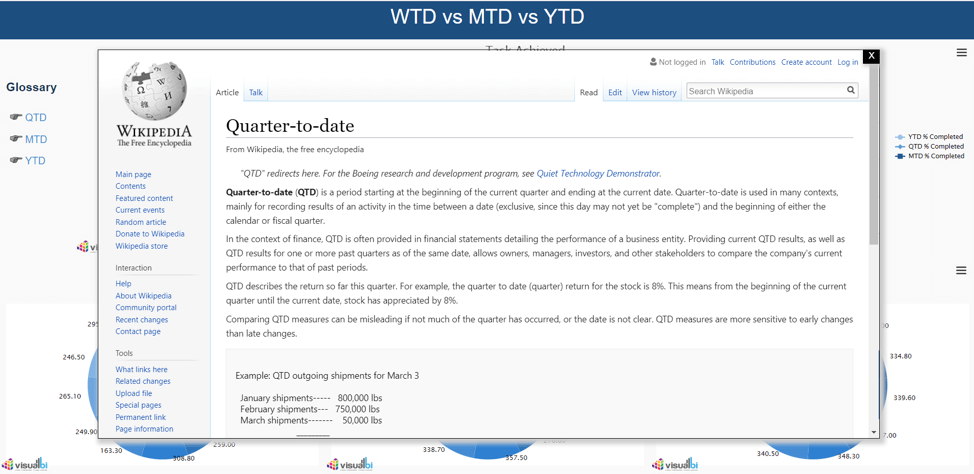
Now our dashboard is completely ready with the glossary that we needed to deliver to the users. Whenever the user needs any kind of clarifications on the abbreviated terms, he can click on the Glossary item and a pop up will show up with the details as seen in the screenshot below.
Summing it up…
This blog puts forward one of the many use-cases of the VBX HTML Box and Script Box components as I had mentioned earlier. Similarly, you can also provide a currency converter application within your dashboard while you deal with multi-currency key figures and many other features which you’d like to have on your dashboard. All you need is a bit of knowledge on HTML, CSS and Javascript and you are all set to create wonders with your visualizations using these two components.
Know more about VBX for SAP Lumira designer here.