
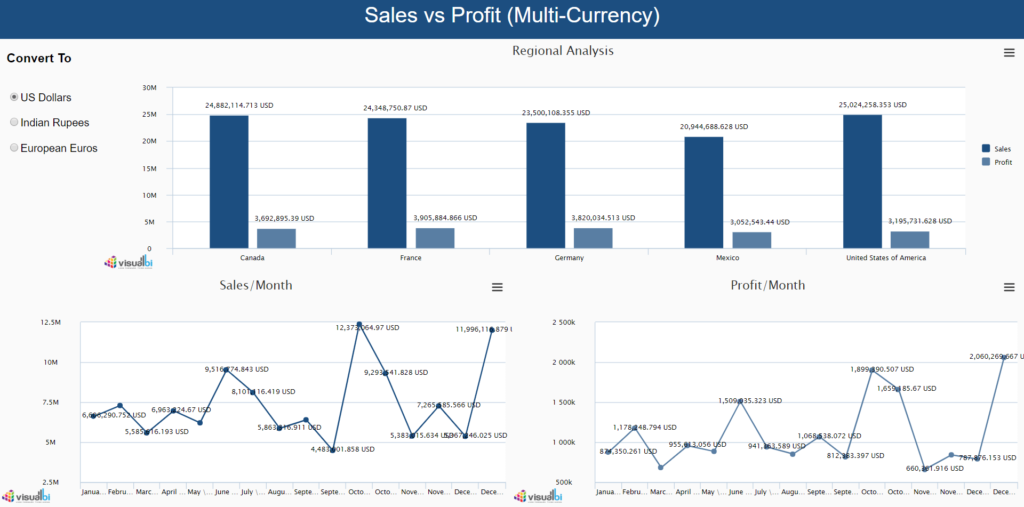
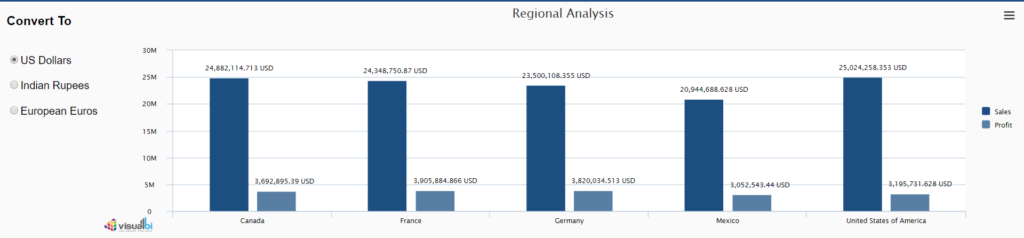
In our previous blog, we have seen the introduction to HTML box and the Script box and how to include a Glossary Index in our dashboard. Here, in this blog we will be going over another scenario where we are dealing with multiple currencies for various measures/key figures. We have a Sales and Profit Dashboard where the key figures are displayed primarily in U.S. Dollars
(as shown in screenshot below). Snapshot of the Sales Vs Profit dashboard.
For the users who are outside of the US, the one thing that might cause an inconvenience is the currency. Some users might want to see the data flow in their native currency.
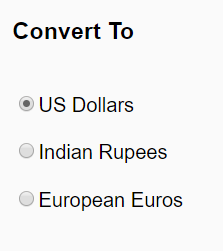
For instance, we can display the same value in 3 different currencies using the Script Box & HTML Box.
- US Dollars (USD)
- Indian Rupees (INR)
- European Union (Euro)
The traditional way is to model the data on the backend with the different types of currencies and provide an option to let the user switch between data internally. But that will take a big toll on time as well as effort. So, we came up with a solution.
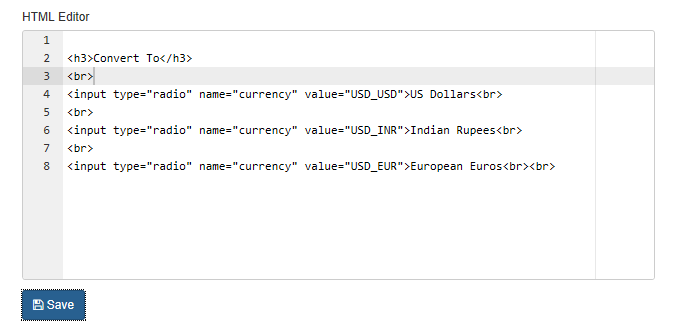
First using the HTML box, we have designed a component as depicted in the below image.
To achieve this, we used the below code in our HTML Box
Now, as the UI is ready, we must provide the functionality to let the user switch between each currency.
Switching between each radio button should change the values in the Column/Bar chart and Line chart to the corresponding currency format the user wishes to see the data in. This can be done with the help of the Script box. We used the below code to convert the currency to selected format.
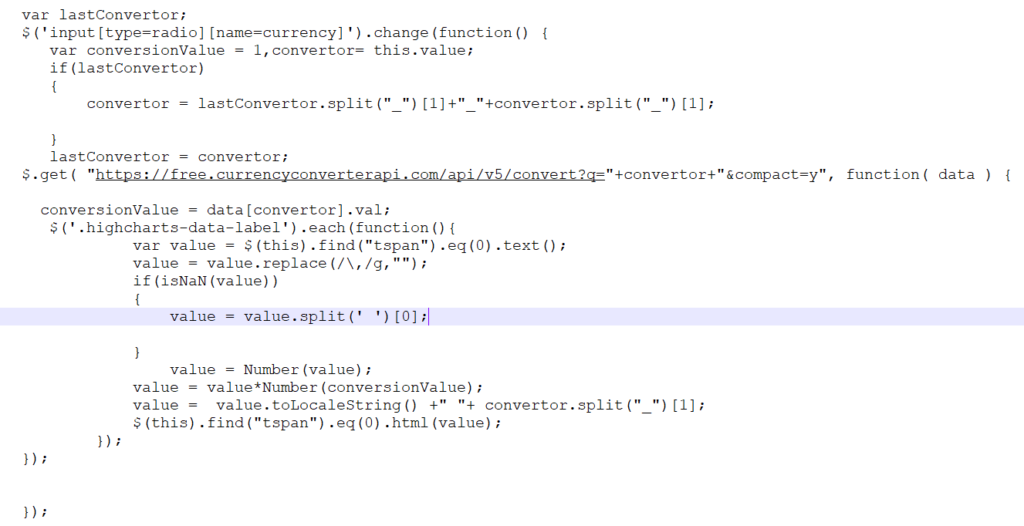
We know that the currency conversion rate varies from time to time. To get the real-time currency conversion rate, we are using an API which provides currency conversion rate for the time of request.
Credits to https://free.currencyconverterapi.com.
At first the charts display the Data in the US dollars (as shown in screenshot below)
Switch between the radio buttons and see the charts change in action (as shown in animation below)
To summarize, we have seen how to create a glossary index in Dashboard and also how to convert real-time data to a different currency format. we are looking at few possibilities of what we can achieve through the help of HTML and Script Box. A lot more can be done when these two powerful extensions combined.
Know more about VBX for SAP Lumira designer here.