Reference Lines
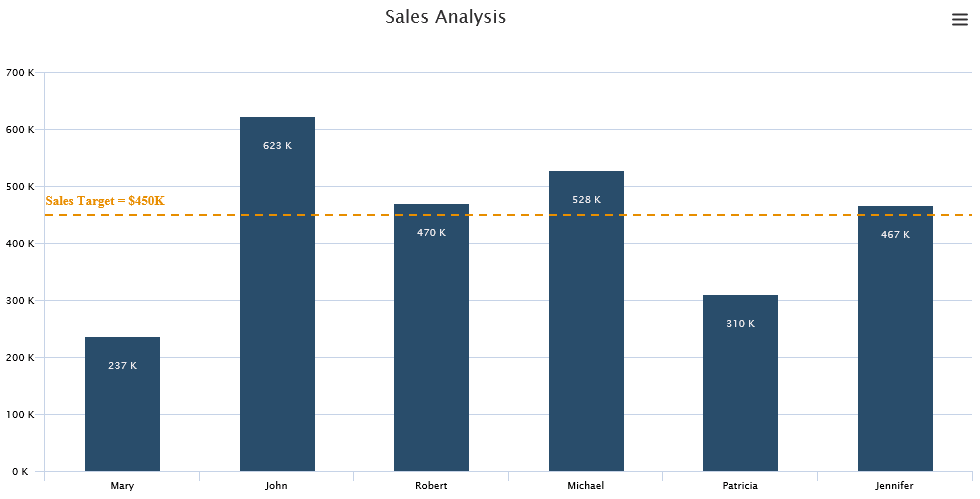
A reference line is a visual indicator used to highlight a certain threshold or key values like average, median, percentile etc. They help in creating more meaningful visualizations and are an integral part of Quality control charts where you have an upper and lower control limit. By adding reference lines, we can compare data points with either static value or aggregate values like average of the measure.
Consider an example, wherein a Manger would like to review his Sales Reps performance. With the help of the reference line, the Manager can easily understand that Mary and Patricia are the only 2 who haven’t met their Sales Target for the current quarter.
The above chart has been created in SAP Lumira Designer using VBX. Using VBX one is not only limited to Bar and Column chart to create reference lines. Following visualization also support reference lines
- Box plot
- Fixed Column Chart
- Line chart
- Stacked charts (Bar / Column / Area)
- Dual Axis / Multi Axis Chart
- Scatterplot / Bubble chart
- Bullet chart
- Advanced Gauge
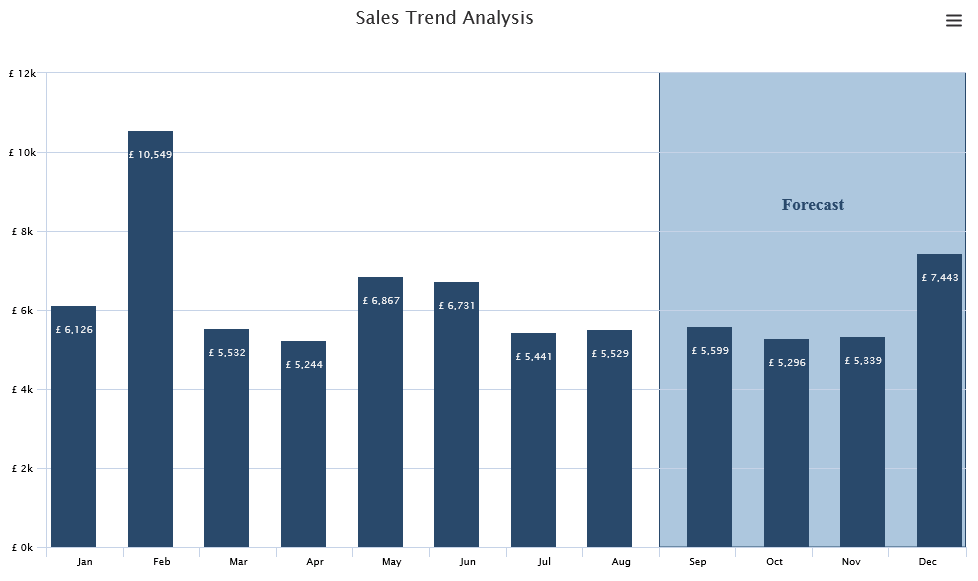
Reference Bands
Reference bands or Plot bands as they are popularly called are shaded plot area between two reference lines used to highlight values which lie under a certain range. One can have reference bands both on X and Y axis depending on the use case.
Y Axis
For example, you may want to highlight values beyond the current month as forecasted values.
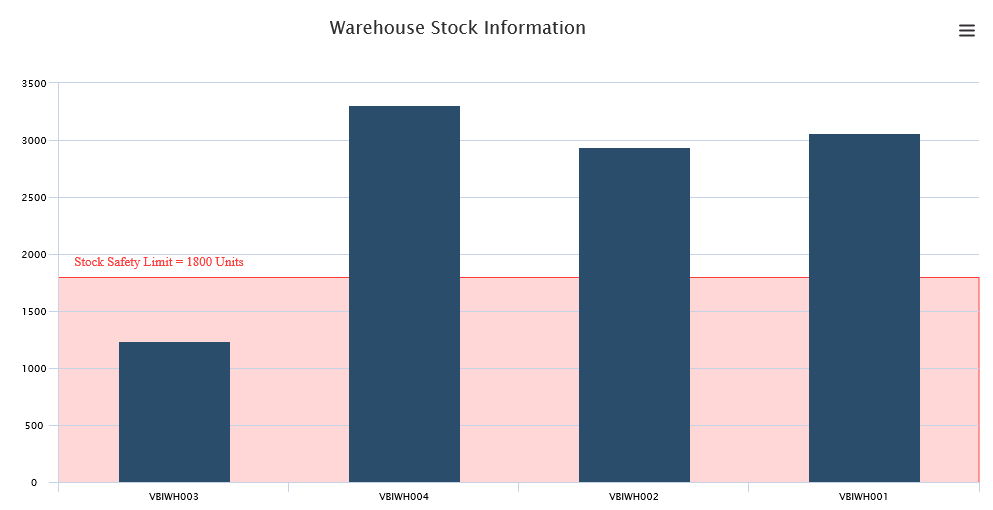
X Axis
Consider an example, where you want to highlight the Warehouse, whose stock for a particular product is below the set threshold value.
Variable limits
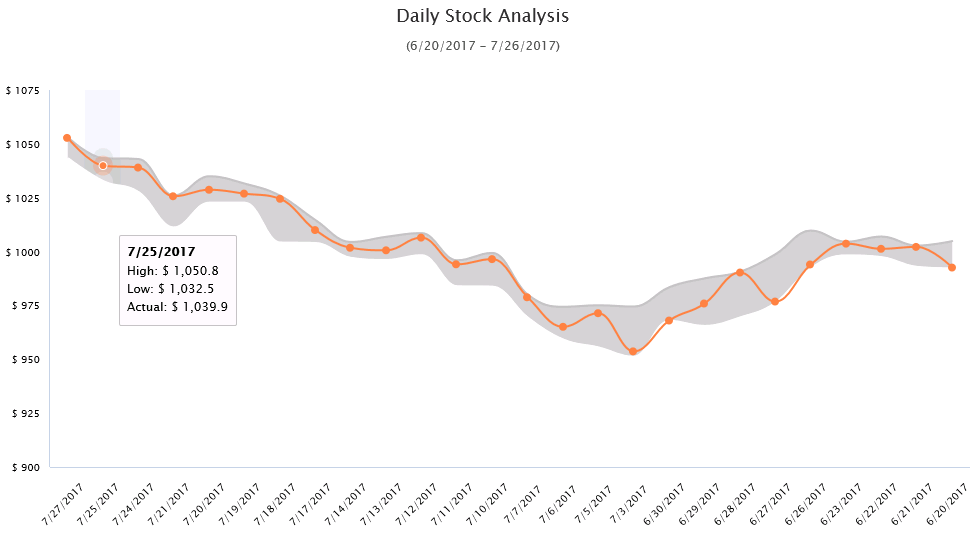
Instead of having static limits, plot bands can also have variable limits. They are mainly used in cases where the upper and lower limit vary according to the data point. Example – Confidence bands, Bollinger Bands, variable QC limits etc.
The following use case have been developed using VBX – Dual Axis Chart
Stock price – high, low and closing price
In the following chart, one can easily visualize the highs and lows of the day along with the closing price of the stock.
As part of the blog series, I will be covering the following topics. So Stay tuned…
Implementing Reference Lines in SAP Lumira Designer
Implementing Reference Bands having fixed limits in SAP Lumira Designer
Implementing Reference Bands having variable limits in SAP Lumira Designer