We are glad to share a sneak peak into our upcoming version of VBX for SAP BusinessObjects Design Studio / SAP Lumira.
In case you are not familiar with our Extensions yet, you can find some introduction material here VBX Extensions. Our Extensions are grouped into five main categories:
- Charts
- Maps
- Utilities
- Selectors
- Speciality
This month we will be releasing the new version VBX 2.3 and here we would like to give a preview of the highlights.
Charts
With this release, we are adding lots of new charting capabilities, some of them are listed below:
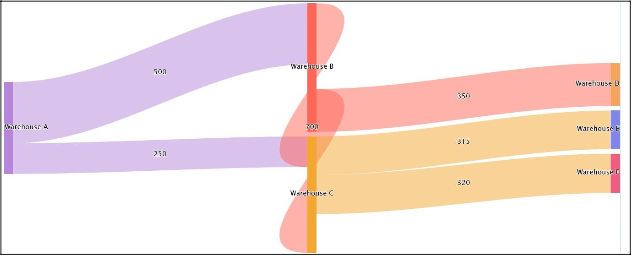
Sankey Chart
Visualize the major transfers or flows within a system (Dimension Members as nodes and key figure as the flow width).
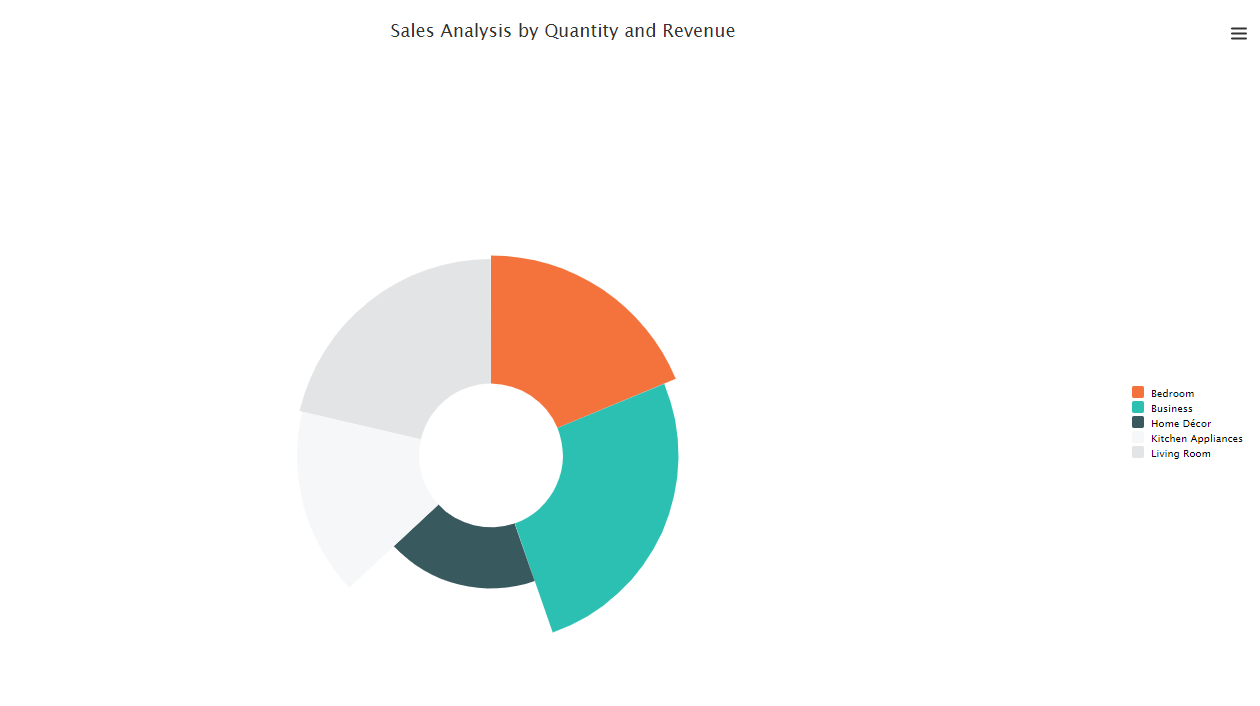
Spie Chart
Overloaded Pie Chart – This enhancement enables visualization of two measures one via segment width (angle) and other via segment height (radius).
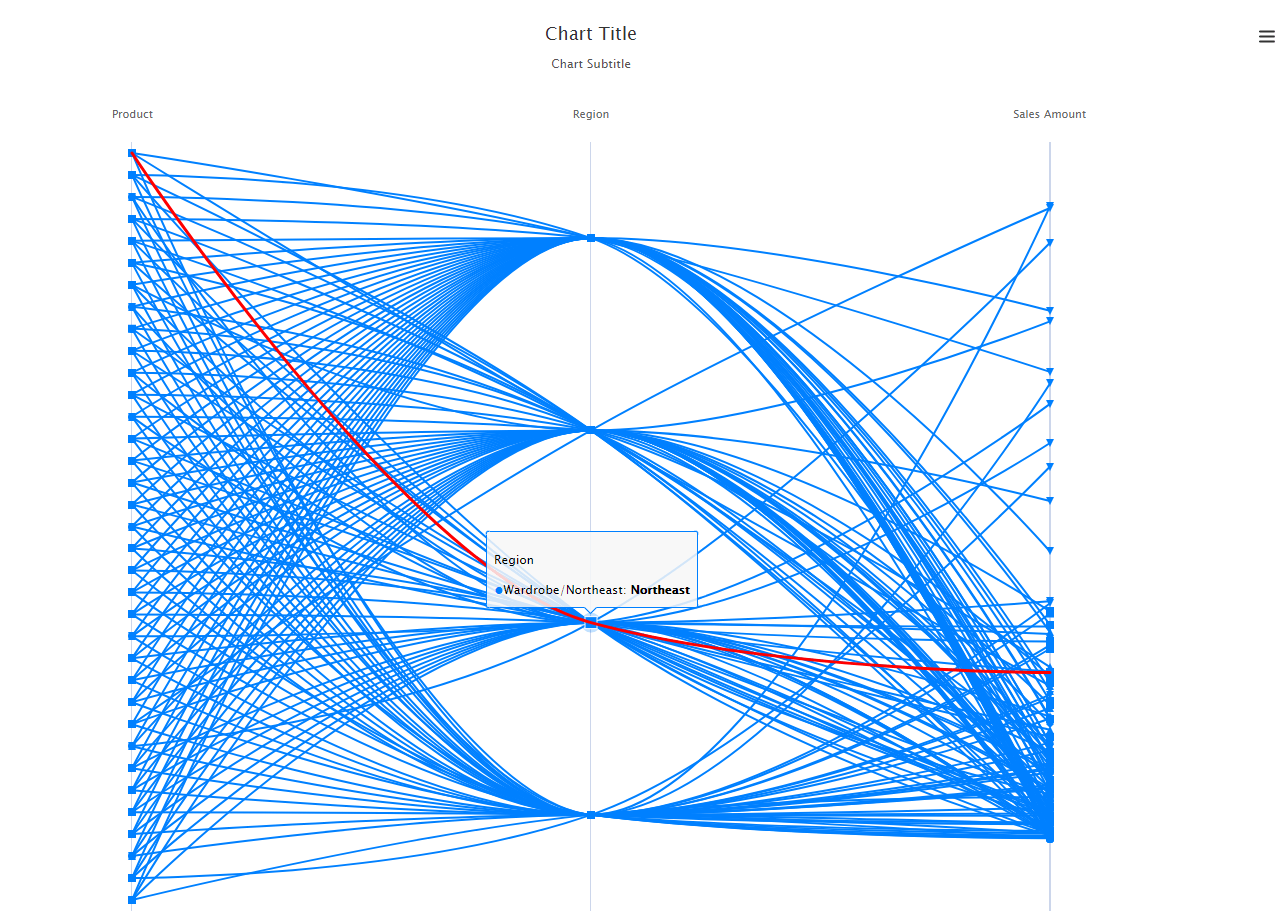
Parallel Coordinates
Enable to compare members of a Dimension across a set of metrics in different scales. Comparing cars based on several specs as an example.
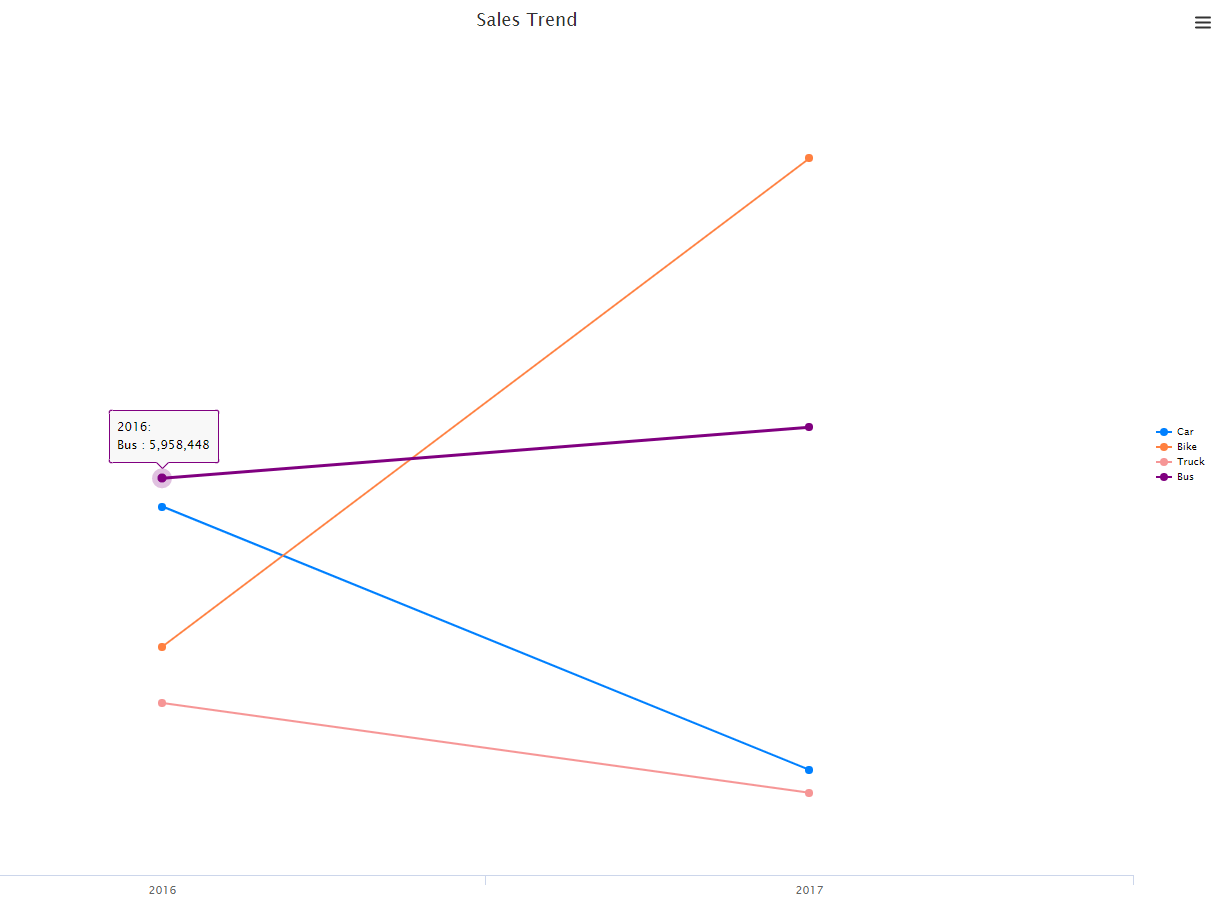
Slope Chart
Make point to point Visualizations to compare two different states using the slope.
Stream Graph
Visualize the changes in data over time of different categories through the use of flowing, organic shapes which makes the representation appear aesthetically pleasing and more engaging to look at.
Ideal for displaying high-volume datasets, in order to discover trends and patterns over time across a wide range of categories.
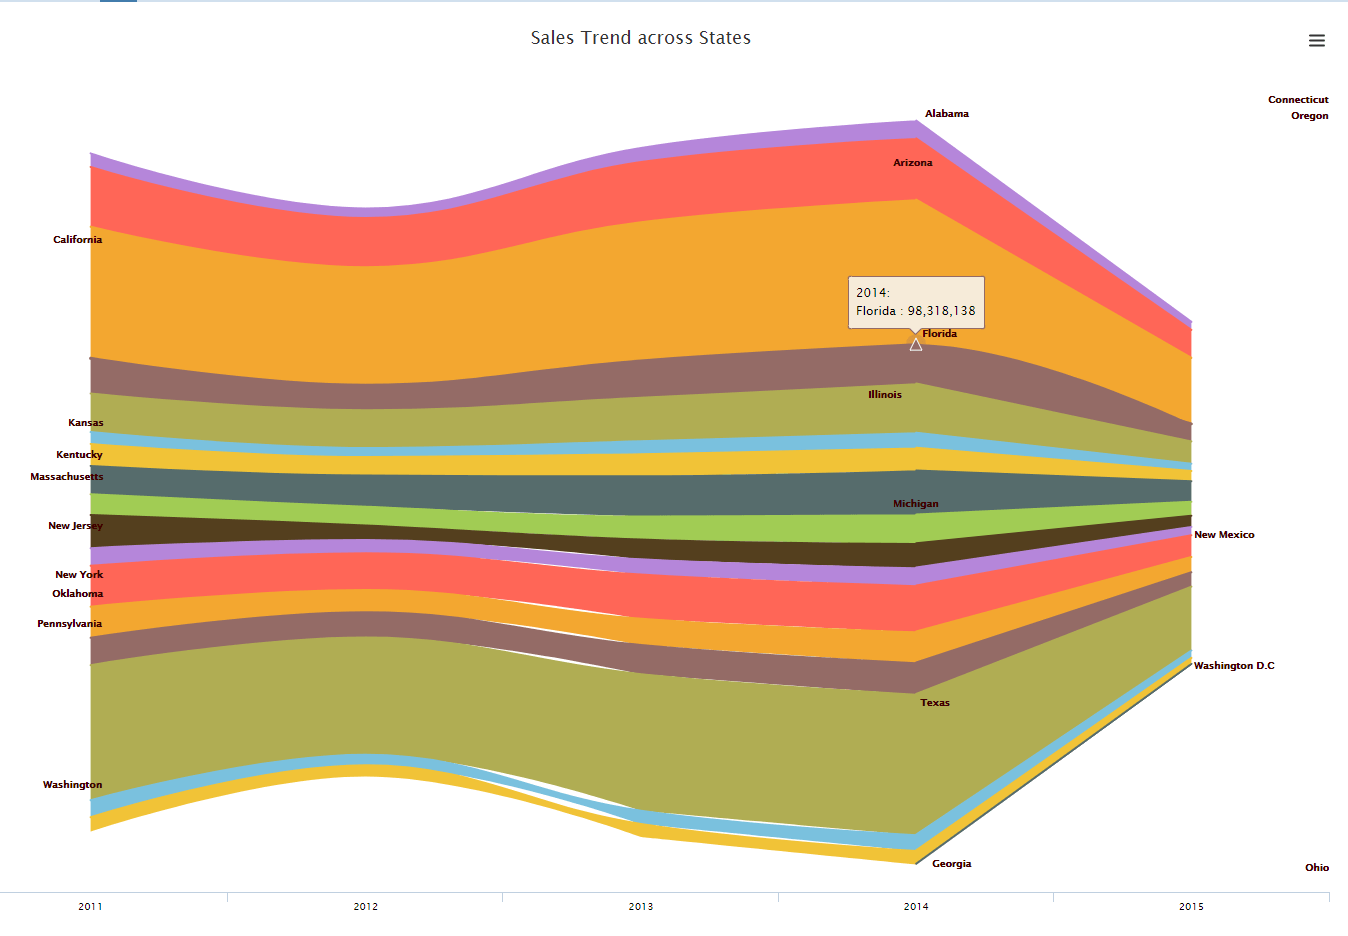
You can notice the Stream Graph doesn’t have a Legend by default, instead it has Labels on top of the plot. This feature that enables users to reduce the usage of screen space, is also available for other charts.
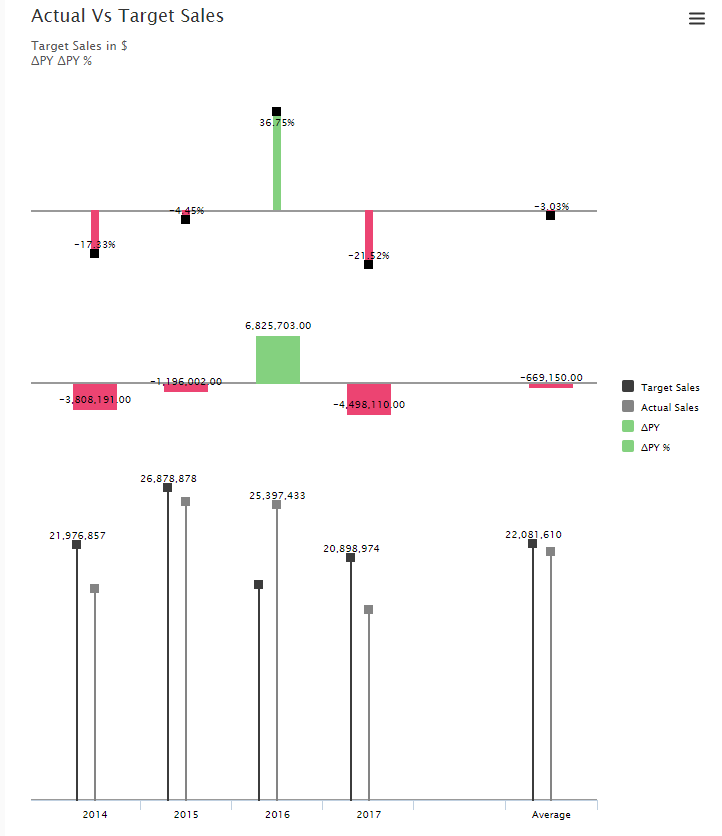
Advanced Column Bar Chart
It offers an intuitive way to compare any two measures. In addition to juxtaposing two measures, it also adds a spotlight to the variance between these measures in terms of absolute and percentage values. Negative or Positive variance is automatically categorized as two series. This removes the need to add conditional formatting to highlight the quality of variance.
Enhancements
Ranking is another built in feature for most of charts. Top N measures can be configured as part of configuration apart from the context menu options.
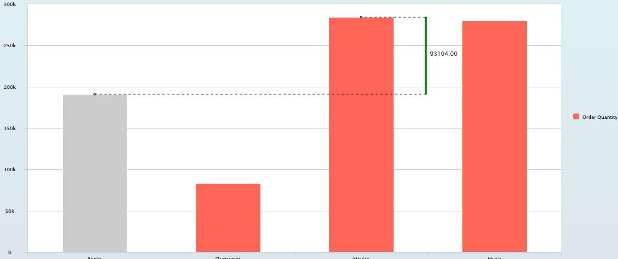
Our Bullet Chart has deviation bar support, in addition, runtime deviation support has been added to most of our charts.
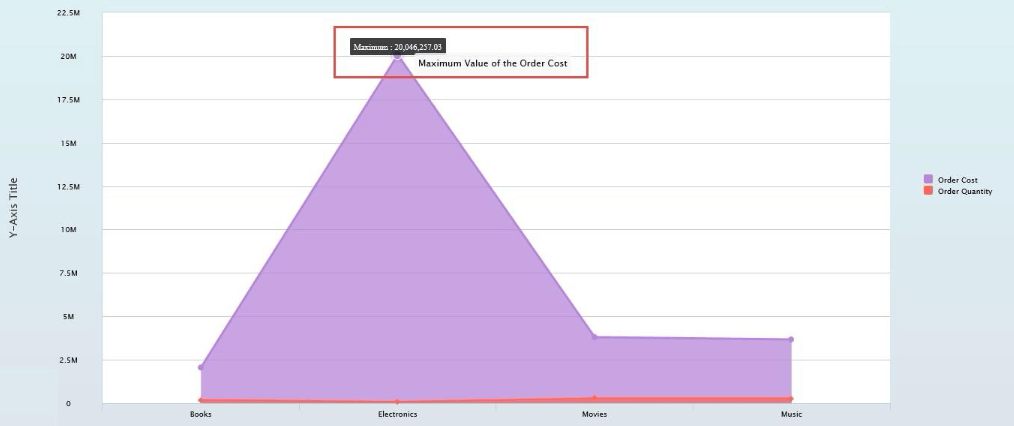
Apart from these above mentioned new charts, we have added Annotation capability to most of our charts.
Also now our charts support hide or show KPI’s on runtime.
Speciality
Data Utility
With this release we are adding our new Data Utility component, that works as data source consolidator, improving the performance of your dashboard. Also it has the compatibility to work with Standard SAP Charts. With this data utility component – you can enable “one datasource into multiple views with no backend changes” and create self-service dashboard scenarios as well.
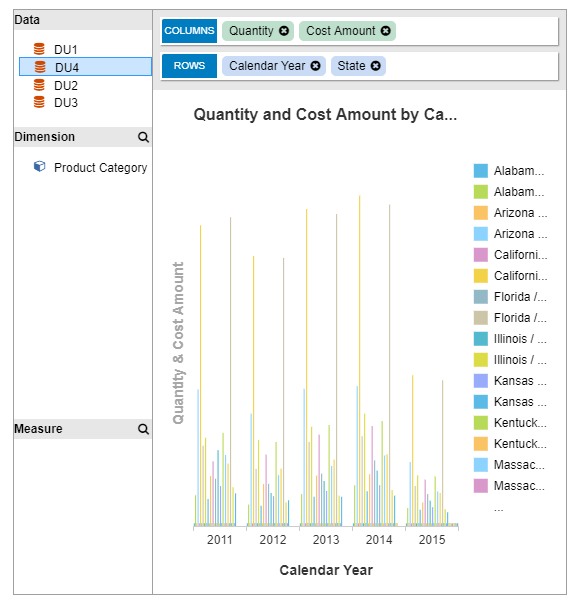
Also it brings the capability to change the datasource of charts during runtime by just using drag and drop.
Enhancements
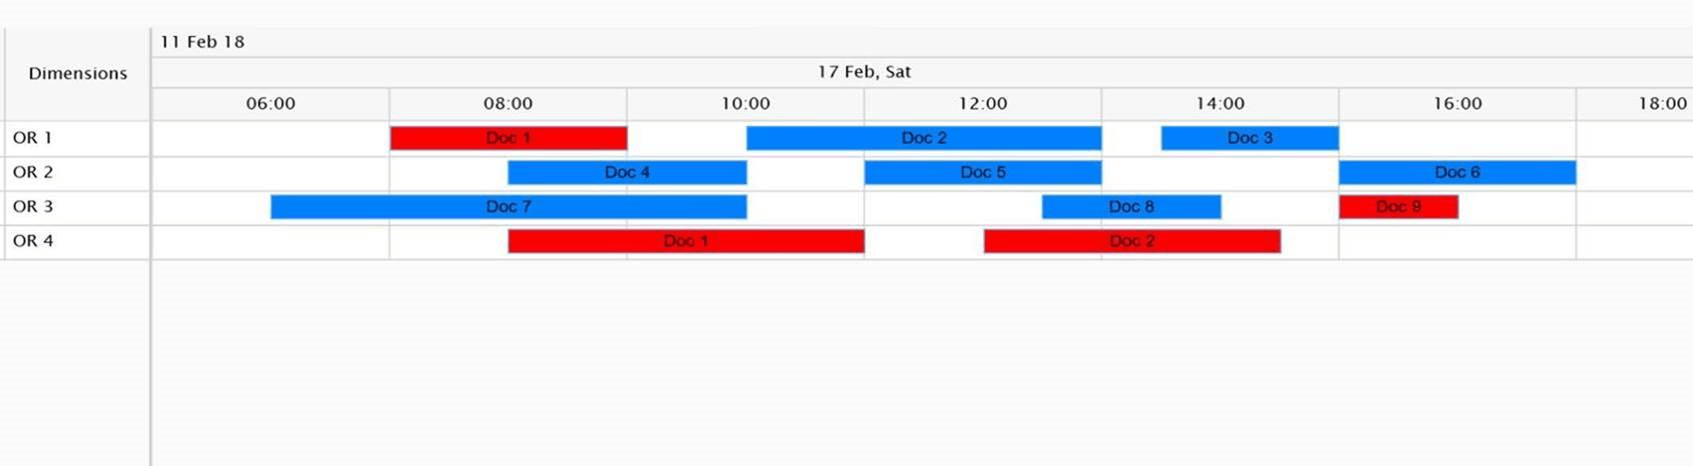
The Gantt Chart now has the capability to add Conditional Formatting, making it easier to provide customized alerts with logical conditioning.
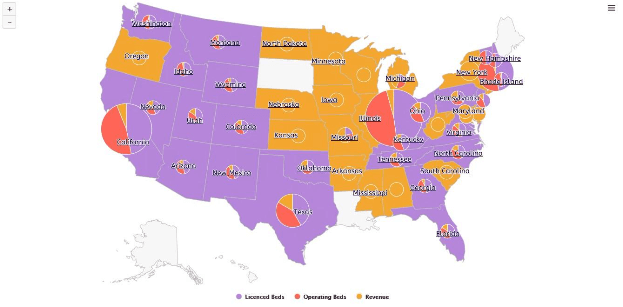
Maps
As part of our maps offering, we are now allowing our customers to plot charts on top of the map visualizations.
Selectors
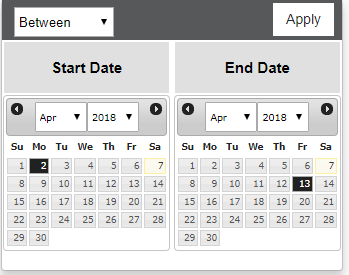
Time Slicer
The New Time Slicer component provides the user with the ability to toggle between two dates with predefined date functions and select whichever needed, making it easier for dynamic date manipulations.
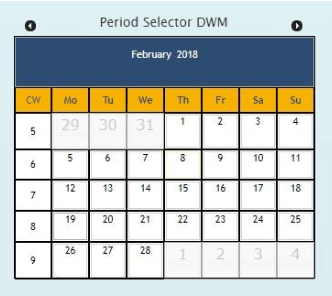
Period Selector DWM component
The Period Selector DWM provides the user with the ability to add a selector to the dashboard, which will allow the user to choose a value for the Day / Week / Month. The Period Selector DWM allows the user to specify a date format from the list of 6 standard return formats such as YYYYMM, MM.YYYY, YYYYMMM. The user can also define a custom format using the option “Custom Format”
Utilities
OData as a Data Source
We added the option to use a REST based service as part of your next Design Studio / Lumira Designer project. This does allow you to use any REST service data to be consumed as part of your dashboard.
Providing the ability for integration to other systems like Google Analytics or SalesForce has been made easy or migrate your Fiori applications to Designer Applications if they are using OData services.
Enhancements
As part of our Utilities category we added a couple of very interesting new capabilities:
Advanced KPI Tile, now comes with multiple themes, 2 sided capability, ability to embed other components and lot more exciting features.
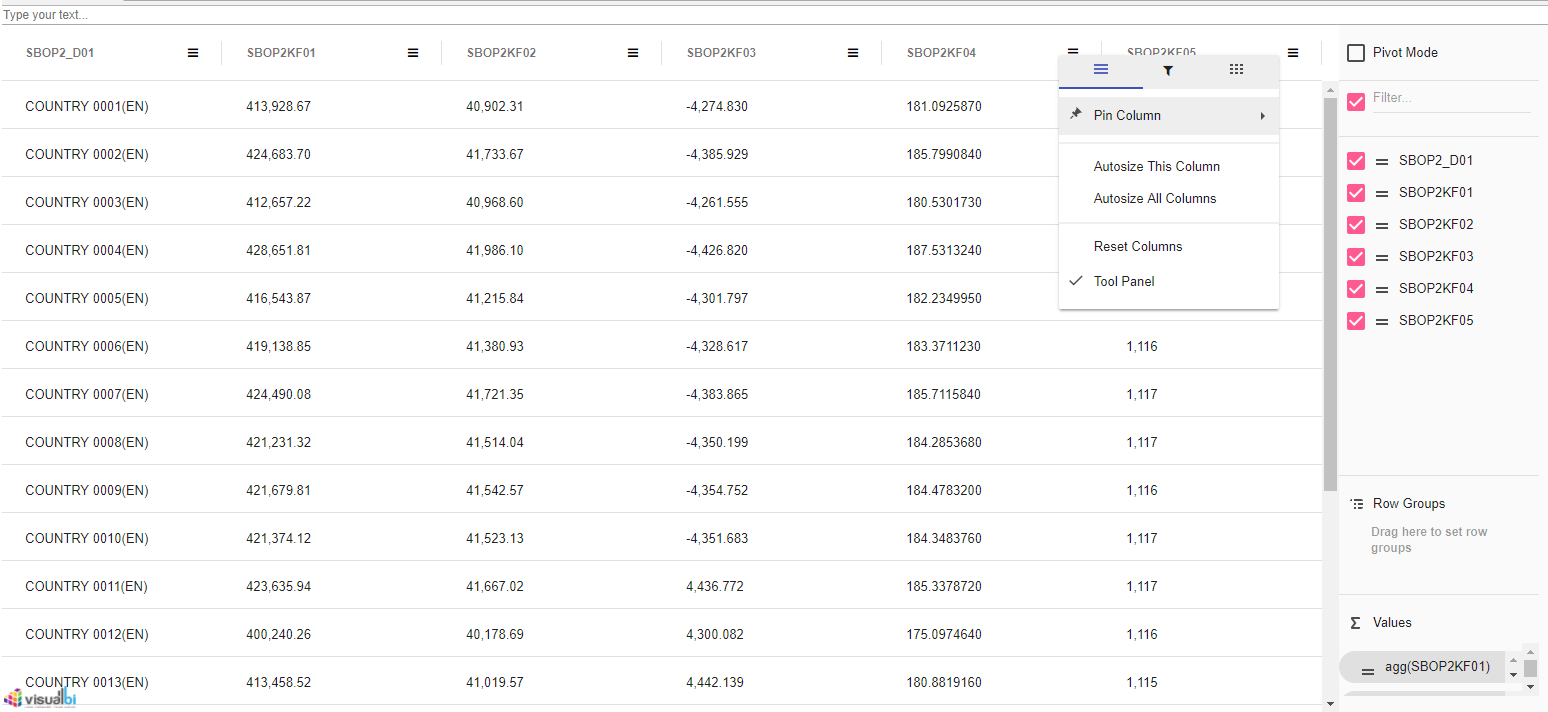
Advanced Table, now has the capability to plot charts based on your KPI, exciting theme options and lot more enhancements. Advanced Table deserves a separate post to explain its features in detail.
Multiple Screen Support
Our Responsive UI now allows users to create dashboards which goes across multiple screens.
You can now use multiple screen designs inside Design Studio/Lumira Designer that gives you the option to truly design a dashboard the way you like it to appear across multiple screens on an Executive Dashboard.
We are looking forward to receiving your feedback on our latest release once it is made live. As you can see, there are several new additional options and capabilities that we are providing for SAP BusinessObjects Design Studio 1.6 as well as SAP Lumira Designer 2.1. This is just the “beginning” of our upcoming roadmap with lot more enhancements coming in every quarter. So, stay tuned for more details on these enhancements in the coming months.