This is part of the VBX Geo Mapping Capabilities blog series.
Maps not only look visually appealing but also help you enhance the effectiveness and usability of the dashboard when dealing with geo spatial data.
VBX Maps offer robust mapping capabilities with the ability to not only choose from a large set of predefined maps (400+ Maps) covering various Countries and their States but also the ability to create your own custom maps based on GeoJSON definitions.
Can we create our custom regions for maps?
I’m sure you would have come across a situation where you would like to display Custom Regions like Sales Territories or a different definition of a region (east coast, west coast…) specific to your organization. VBX Maps offer you the capability to not only plot standard regions like Countries, States, Counties, Addresses etc. directly from your data source but also plot Custom Regions.
The Custom Region Maps based on GeoJSON definition can be created using both VBX Location Analyzer and VBX Heat/Bubble Map. Each offers you a slightly different UI depending upon your needs. In this blog we will be looking at how to create Custom Region using the Heat/Bubble Map in SAP Lumira Designer.
Custom Region using the Geo Heat/ Bubble Map
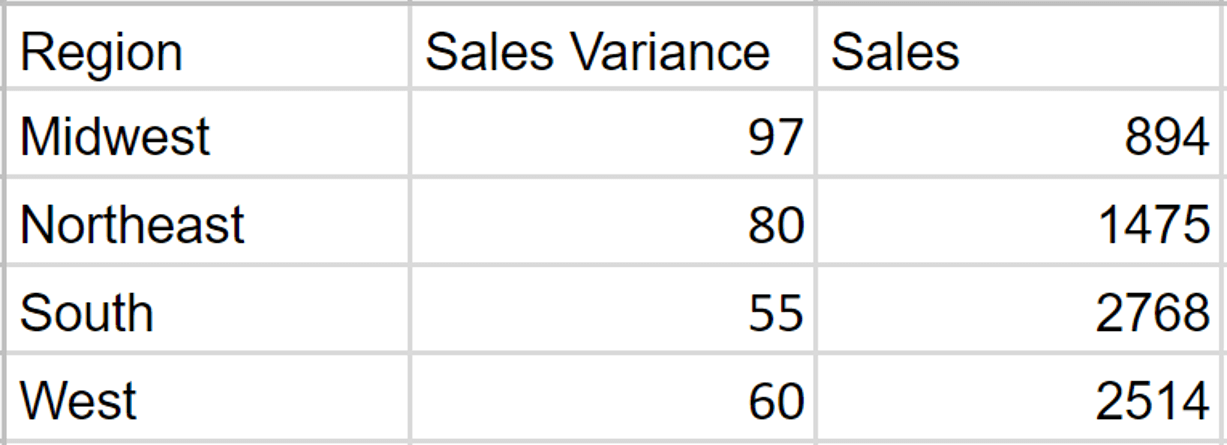
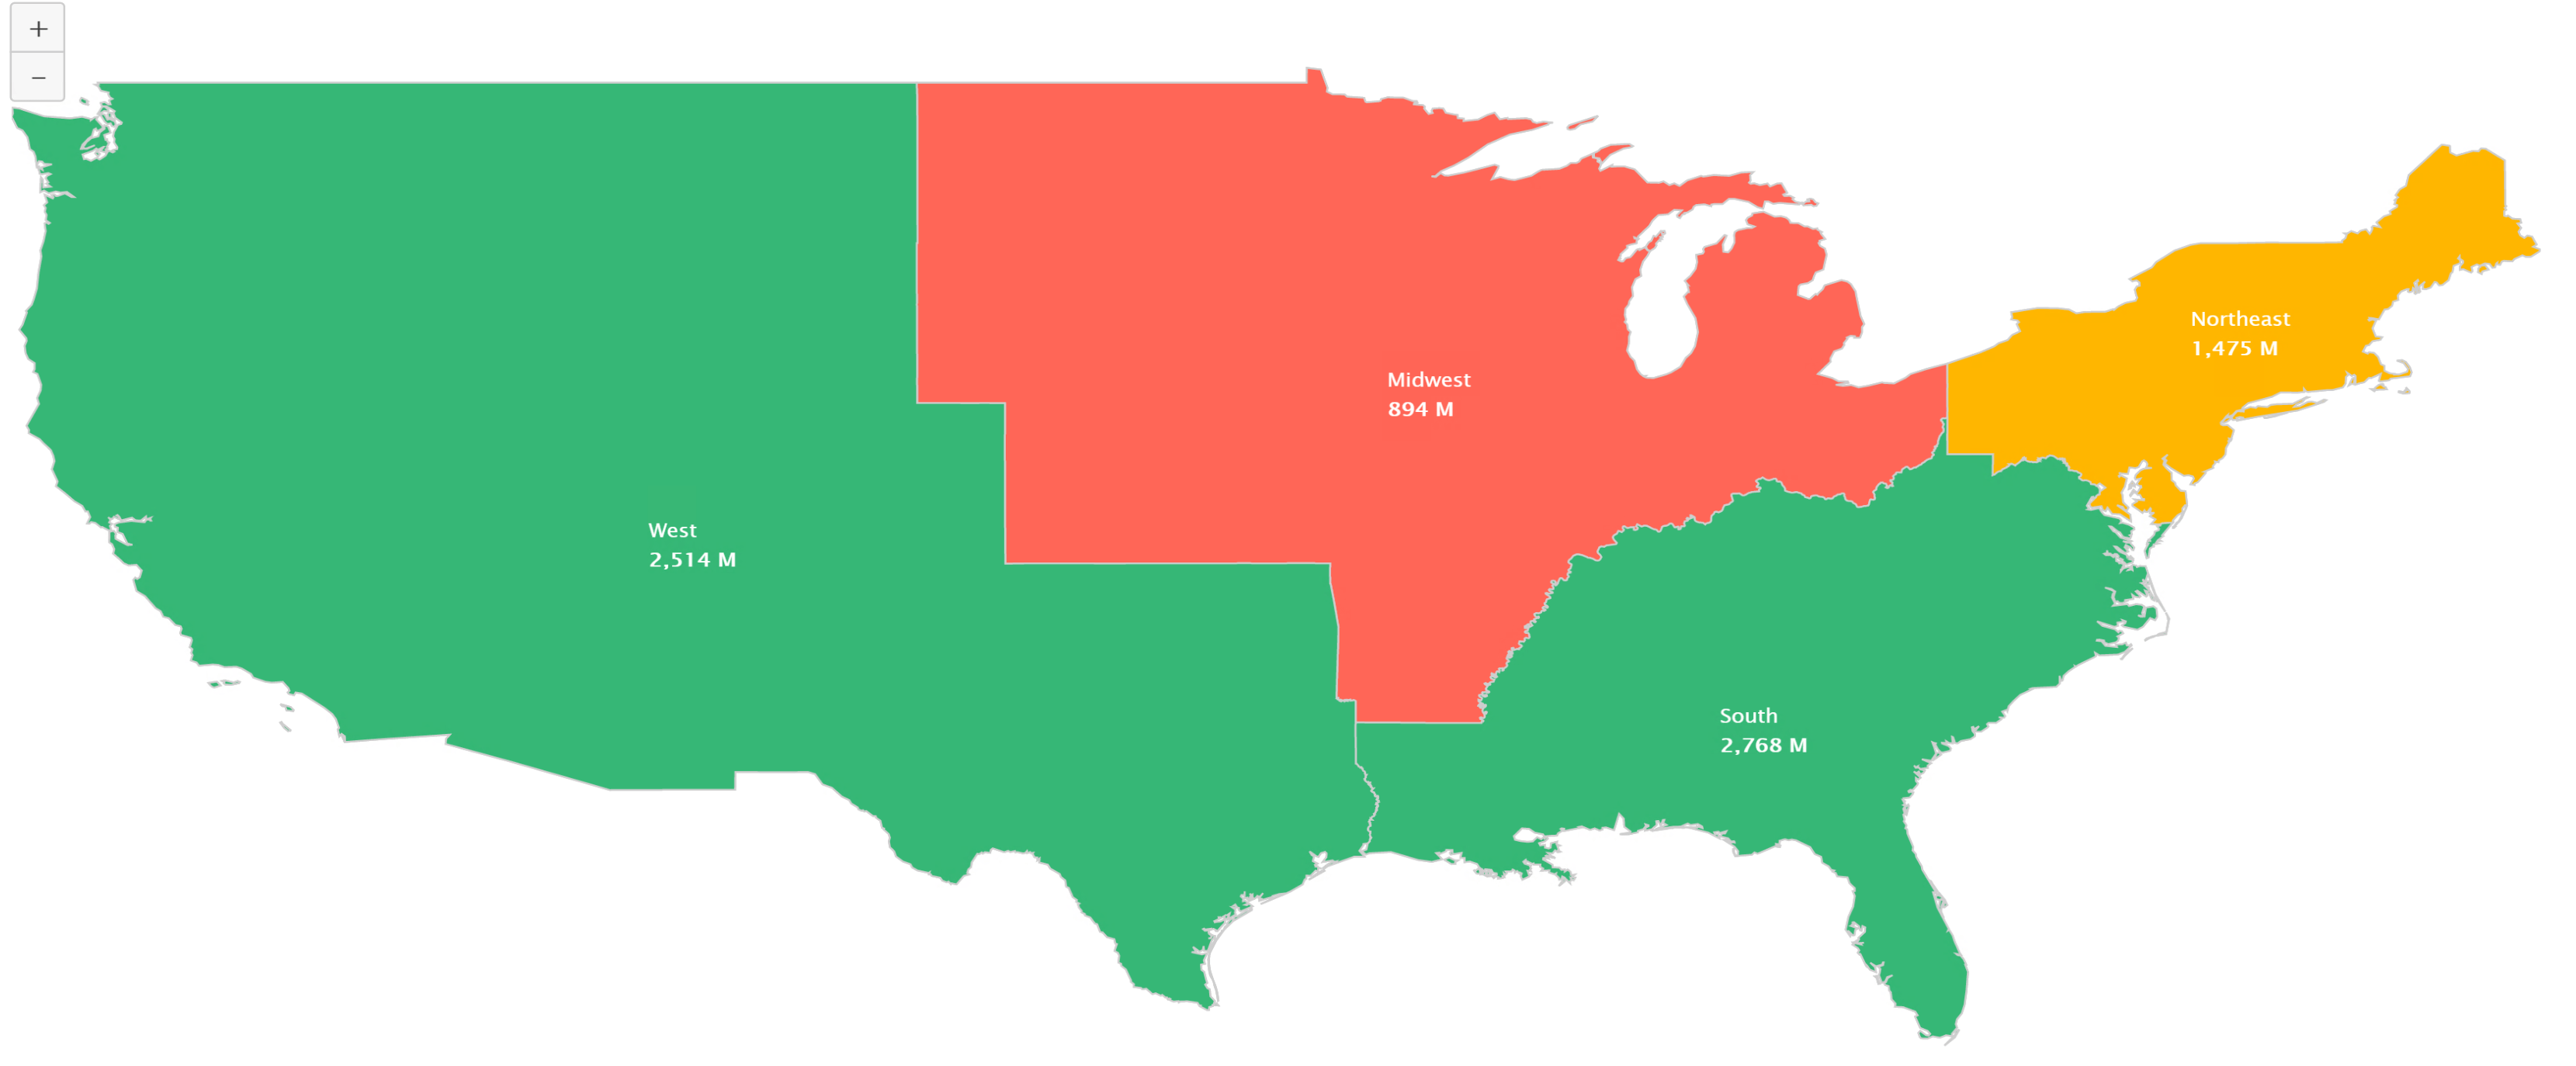
So, let’s consider an example where you would like to map different KPIs based on the custom region definition –Northeast, Midwest, West and South.
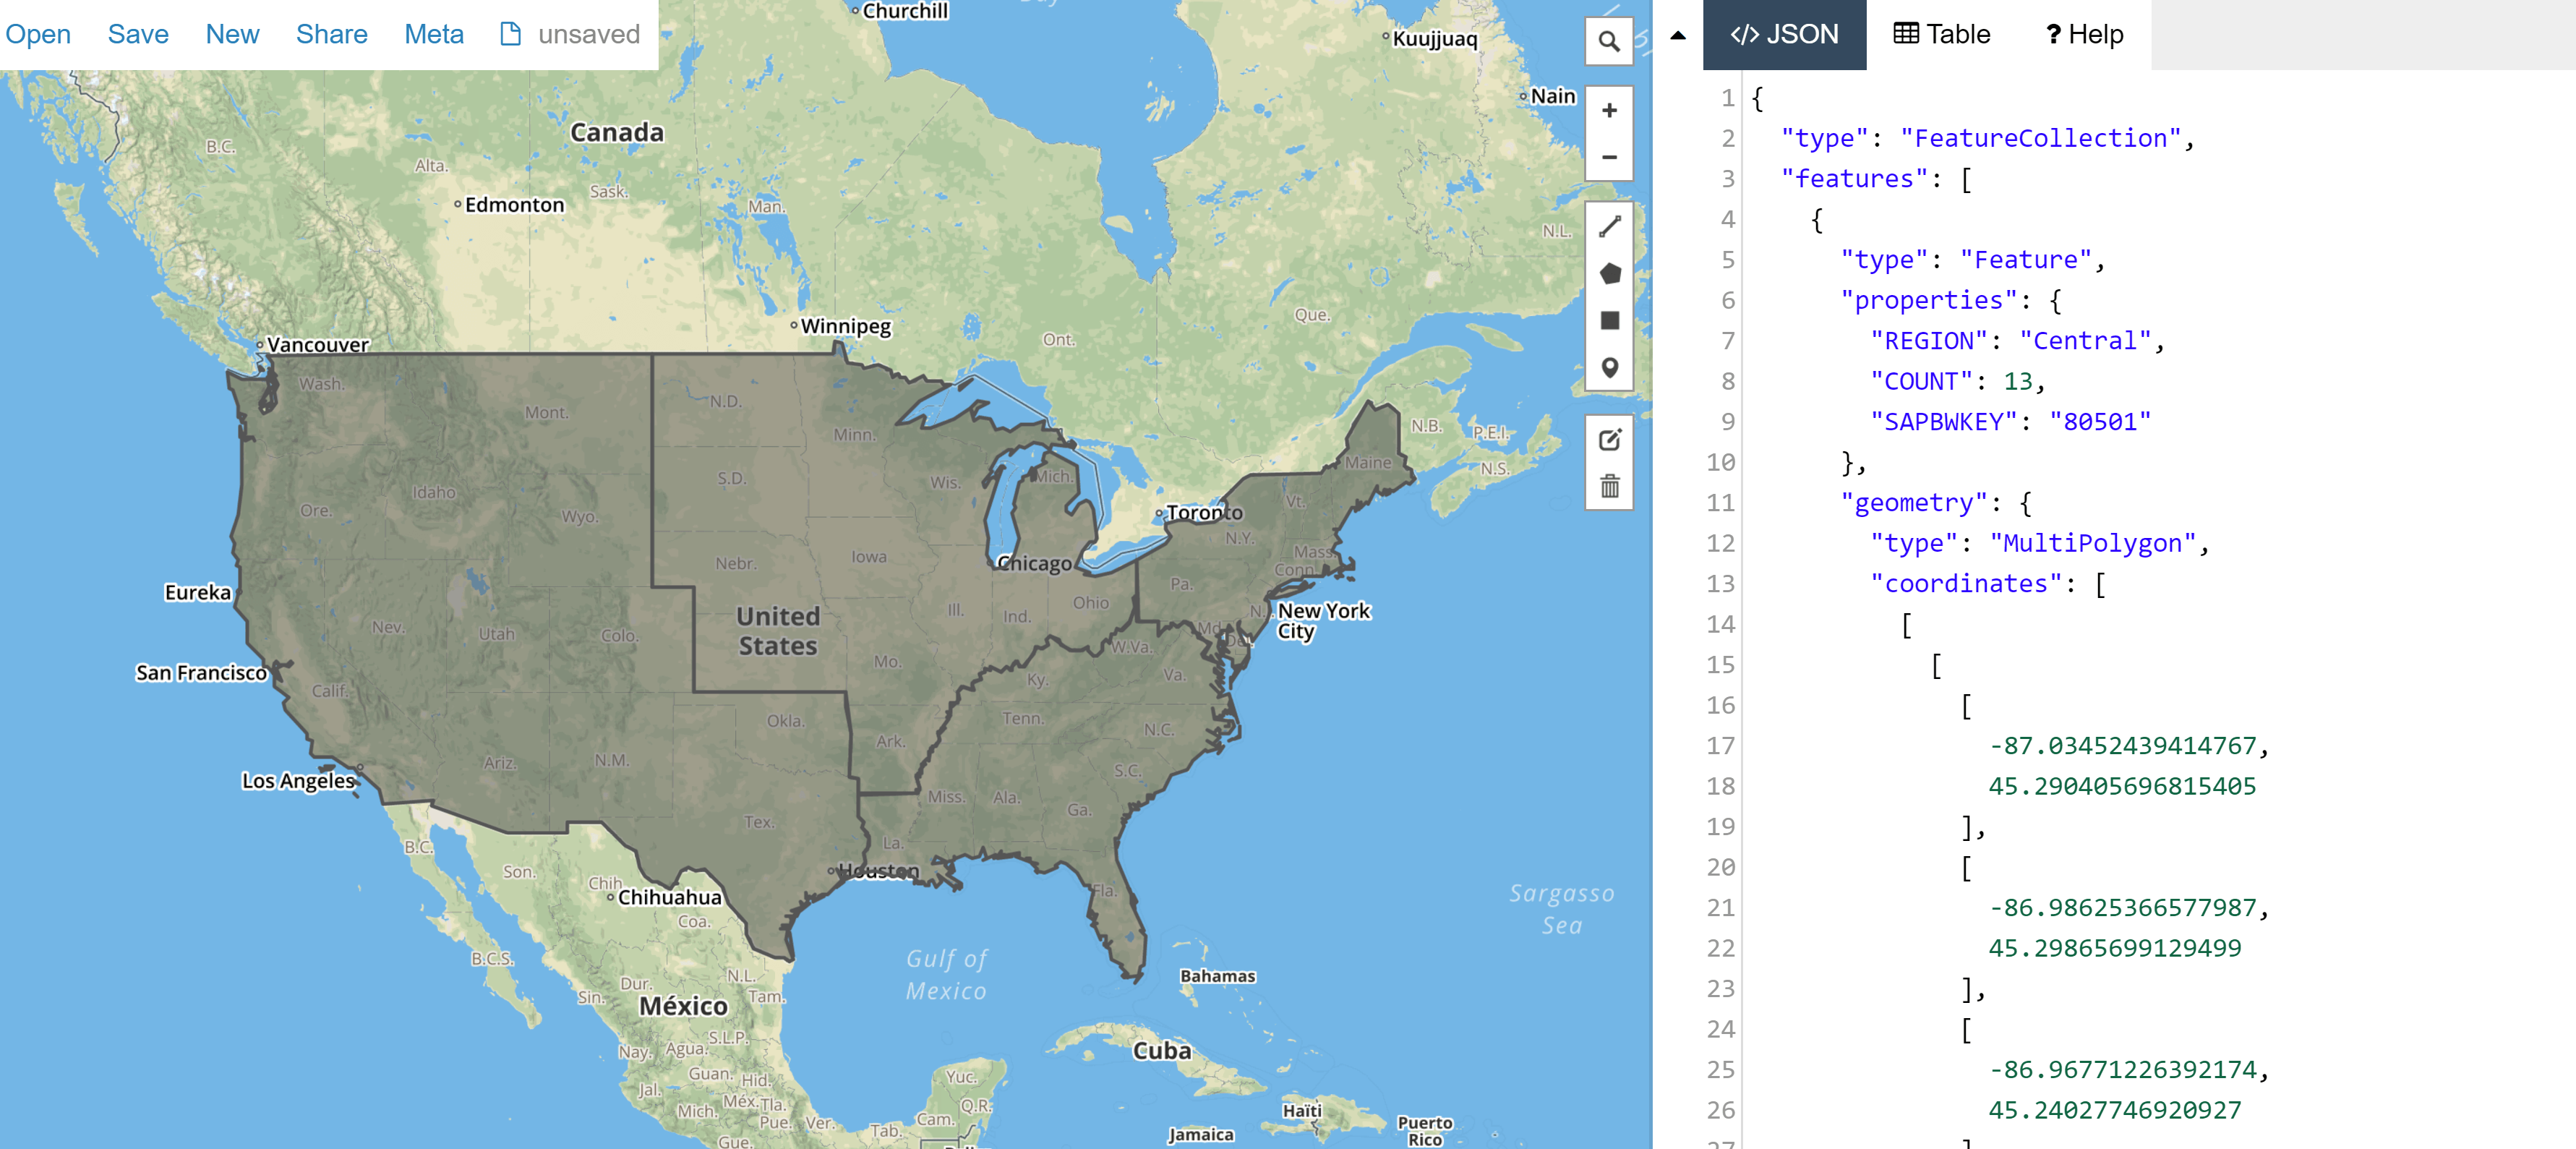
Step 1: Creating GeoJSON for the custom regions.
Creating GeoJSON can be very simple, there are several websites which could help you with this. I used geojson.io to create my GeoJSON for the below example.
Step 2: Drag the VBX Geo Heat/ Bubble Map in your canvas and connect it to the data source containing the geo-spatial data.
Data
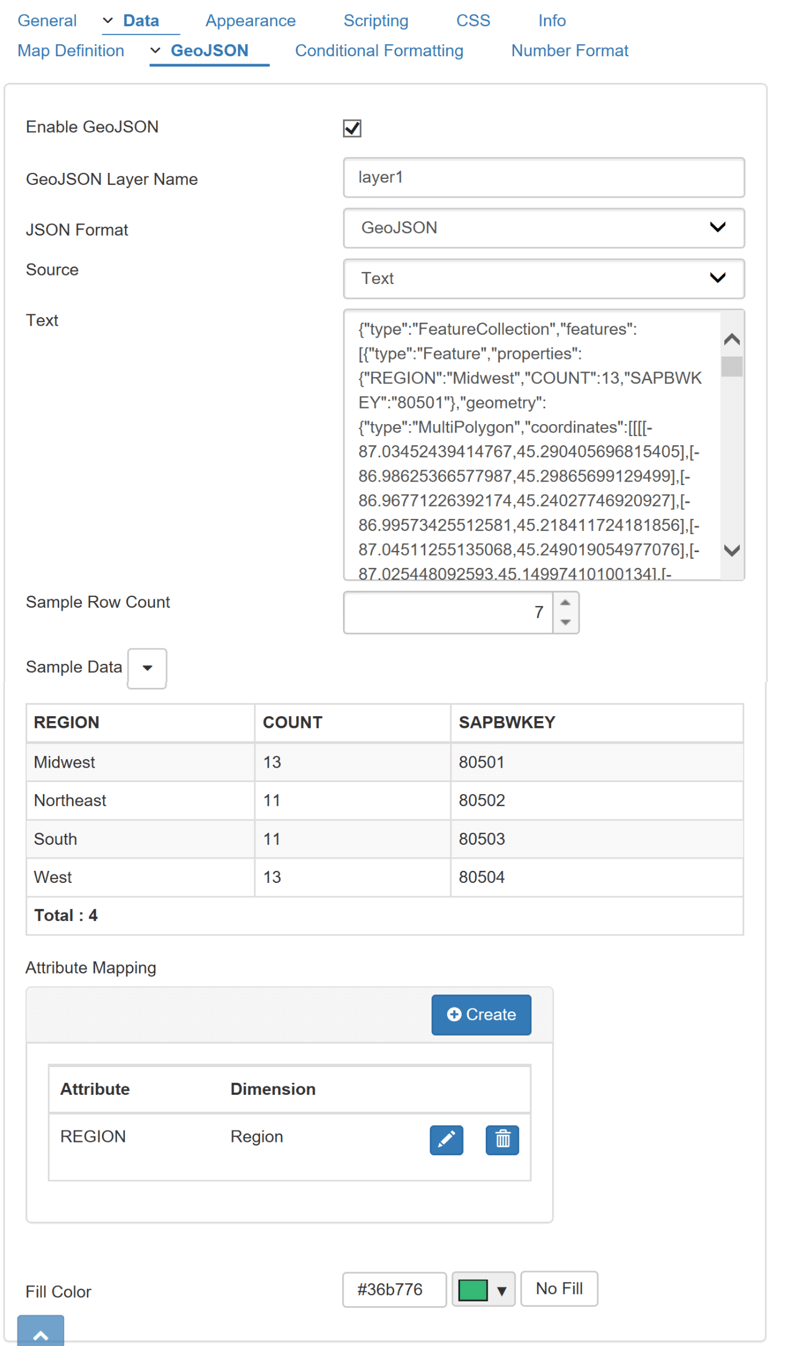
Step 3: Map the Data with GeoJSON
- Navigate to the GeoJSON tab name your layer – Layer1 as seen below.
- Set the JSON format and source as shown below.
- Select the source as text and Paste the GeoJSON text in the space provided.
- The next step is to map the GeoJSON attribute to the Region dimension from your data source and to provide a color for the created layer.
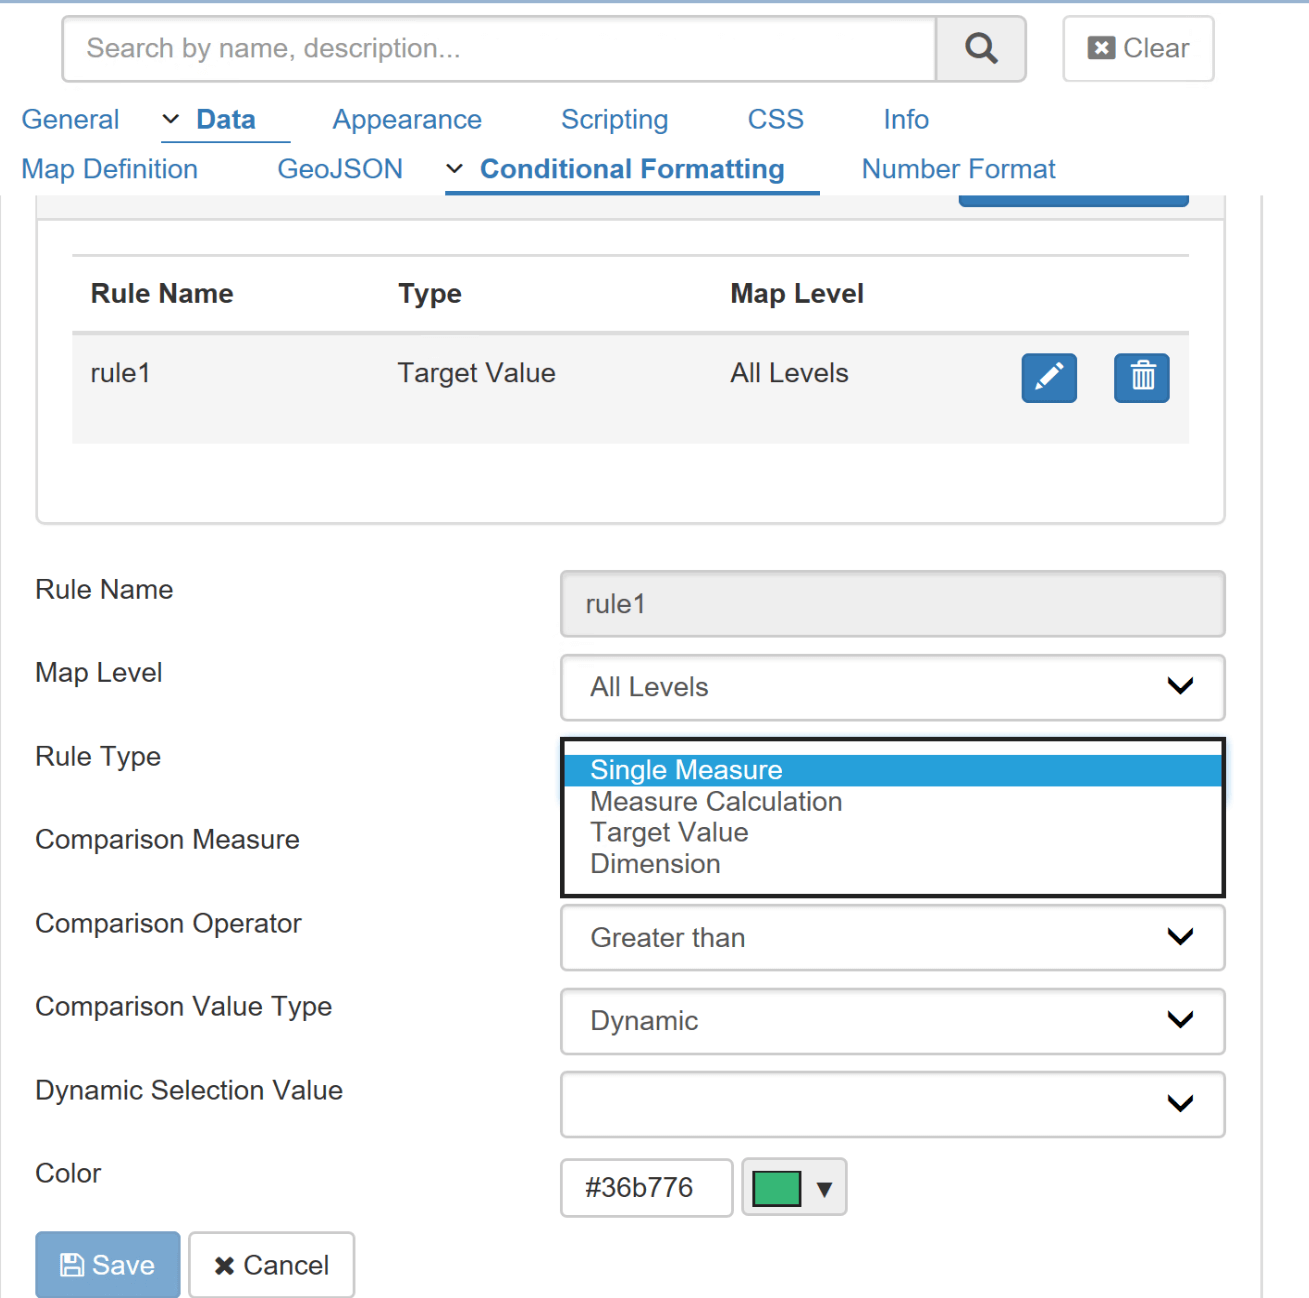
Step 4: The Last step is to assign different colors to your regions, which is done using the conditional formatting options. You can assign colors based on both dimensions and measures.
Dimensions: For e.g. if you want each region in a different color.
Measures: For e.g. if you want to color code based on a particular conditional formatting rule that compares against a static or dynamic value from a single measure, target value or measure calculations.
Finally, our map with Custom Regions is ready!
In the next blog we will look at creating Drilldown Custom maps using VBX Location Analyzer, so stay tuned..
Click here to download a FREE 15-day trial of VBX for SAP BusinessObjects Design Studio.