In the earlier blog, we discussed about The importance of Reference Lines and Bands along with some Use cases.
Taking those use cases as an example let’s look at implementing one using VBX
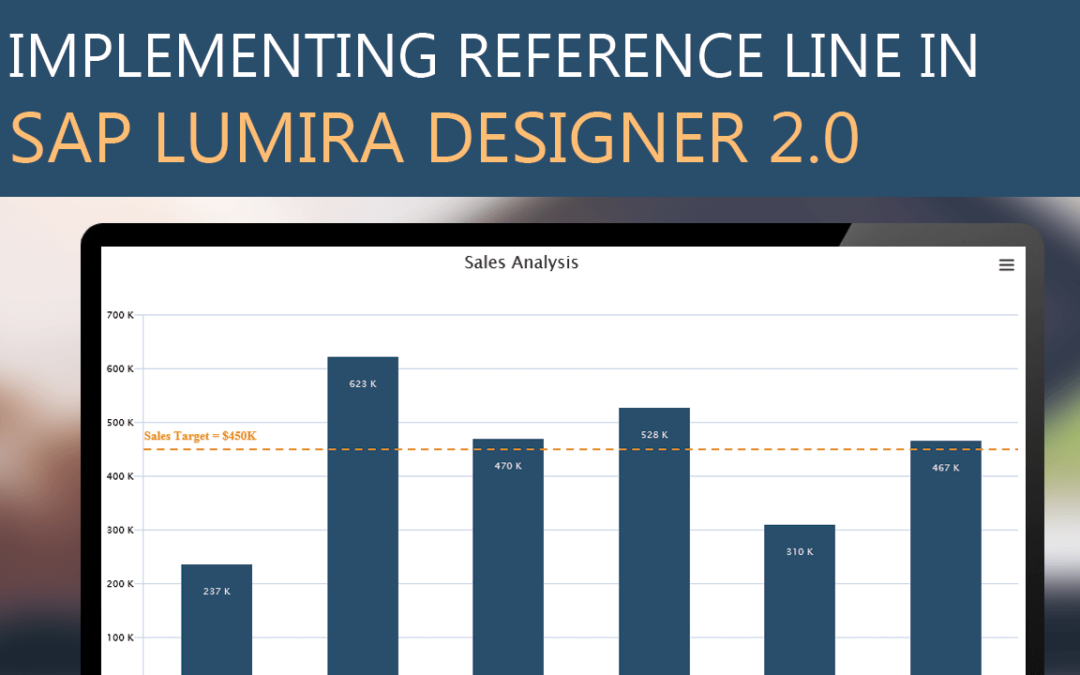
Implementing Reference Line in a chart

In this blog, we will be look at implementing both Static as well as a Dynamic Reference Line
Static Reference Line
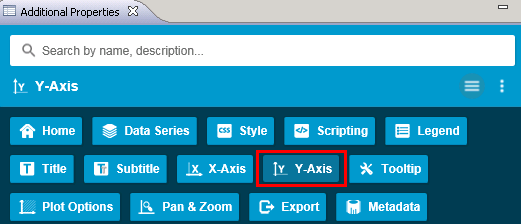
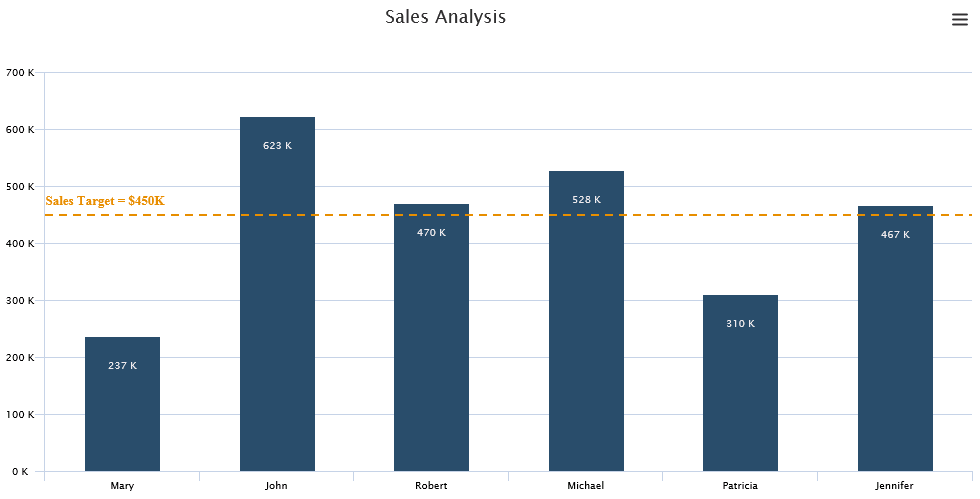
To create a Reference Line in SAP Lumira Designer using VBX, navigate to the additional property sheet and select Y Axis Tab from the Menu option.
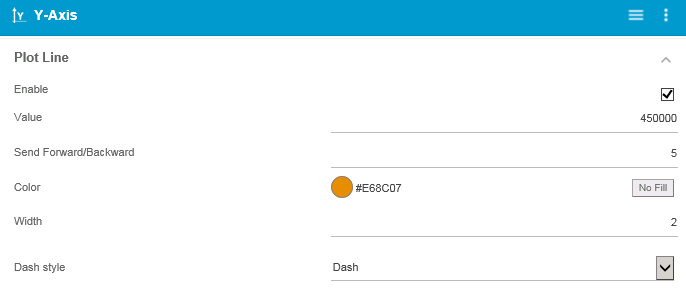
Scroll down to Plot Line properties and set the properties as follows:
- Tick the checkbox to enable the Plot line
- Enter the desired value (450,000 in the example below)
- Set the color of the line (yellow in the example below)
- Set the line properties – width and line style (width= 2 and line style = dash as seen below)
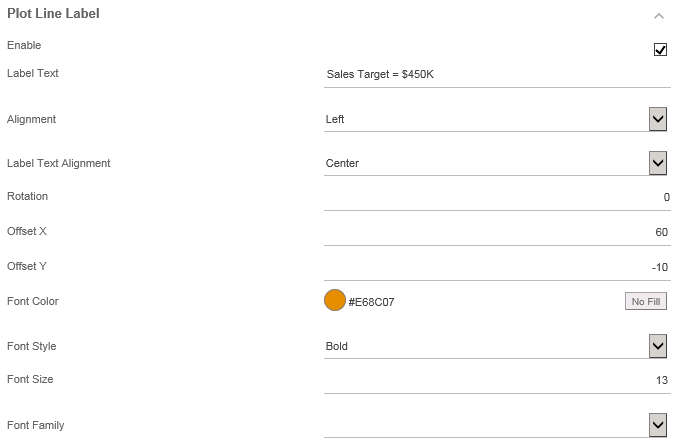
Further, we need to provide a label for the plot line
- Tick the checkbox to enable the Plot line label
- Set the label text according to your requirement (Sales Target = 450k in my example below)
- Set the horizontal and vertical alignment of the label (Alignment= left and Label text alignment = center)
- For additional flexibility and proper placement of the label you can also use the offset property (X offset = 60, Y offset= -10)
- Set the font properties as desired (color = yellow, Font size= bold and font size=13)
Voila! VBX Column chart with Reference line (a.k.a Plot Line) is ready
Dynamic Reference lines
As seen above, one can easily visualize Sales Reps who haven’t met their target. But what if we wanted to look at Sales by product lines having different Sales Targets?
This could be achieved using VBX robust API Library.
DSXSetYAxisPlotLineValue(VALUE) – Set the Value of the Reference Line
With the help of the API you could set the value of the reference line, such that the Sales Target gets updated dynamically according to the selected Product.
Reference Lines in other charts
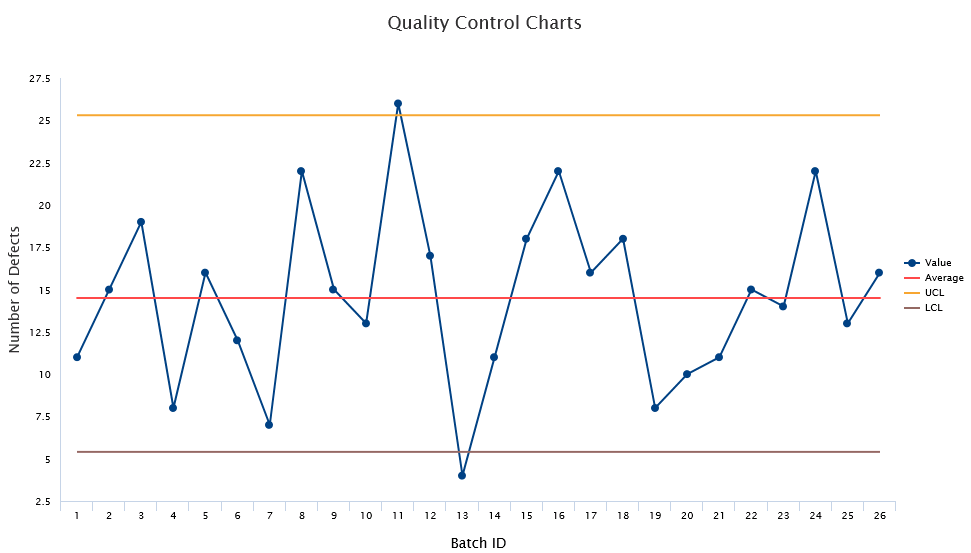
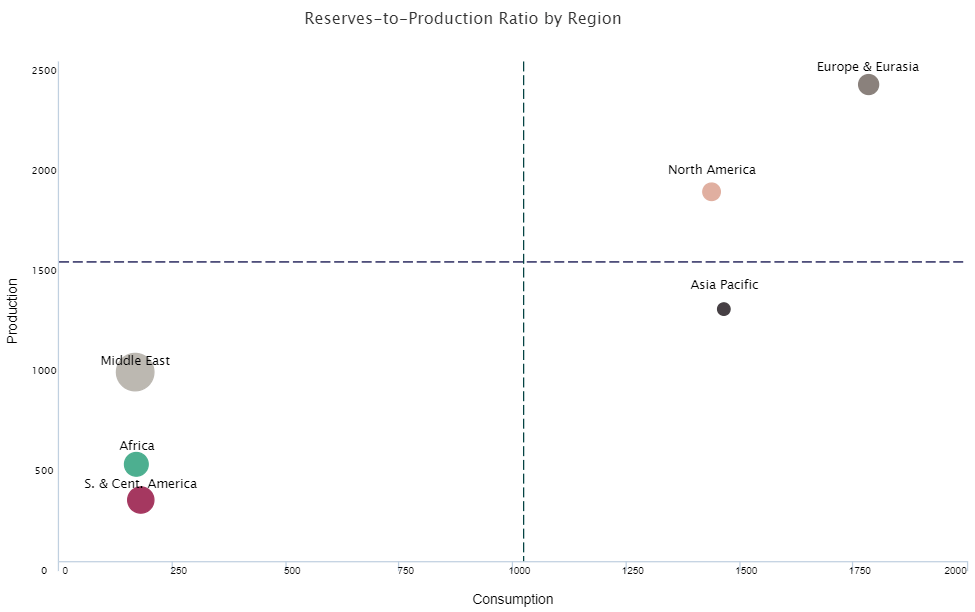
Reference lines are not only limited to Bar / Column charts. Following are a few examples showcasing reference lines in other charts.
Line Chart
Bubble Chart
Similarly usinVBX, we can also create reference bands to highlight values lying under a certain range
Implementing Reference Bands having fixed limits in SAP Lumira Designer
Implementing Reference Bands having variable limits in SAP Lumira Designer
Click here to download a FREE 15-day trial of VBX for SAP BusinessObjects Design Studio.