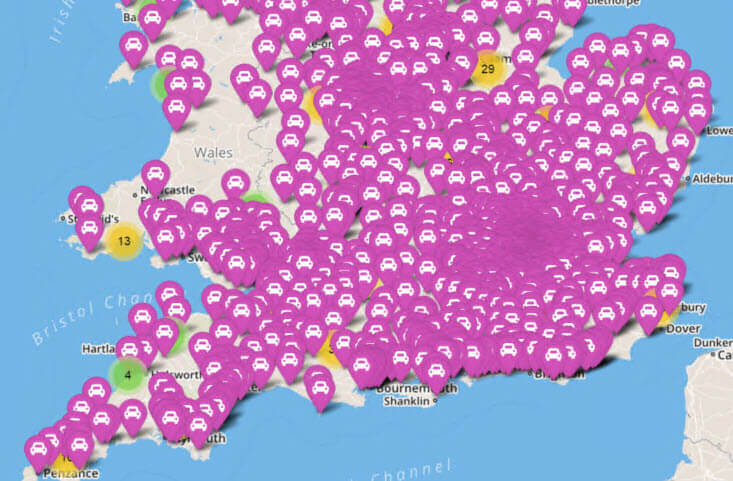
In the first part on Location Analytics, I showed how you can quickly leverage the information you have and generate a choropleth style map or a bubble map. In our second example, we will use the integration with OpenStreet Map and leverage data based on longitude and latitude information as part of the map.
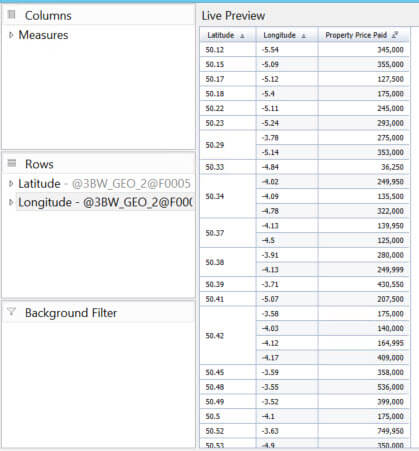
Figure 1 shows the dataset that we are going to use, showing dimension Longitude and Latitude as well as our measure.
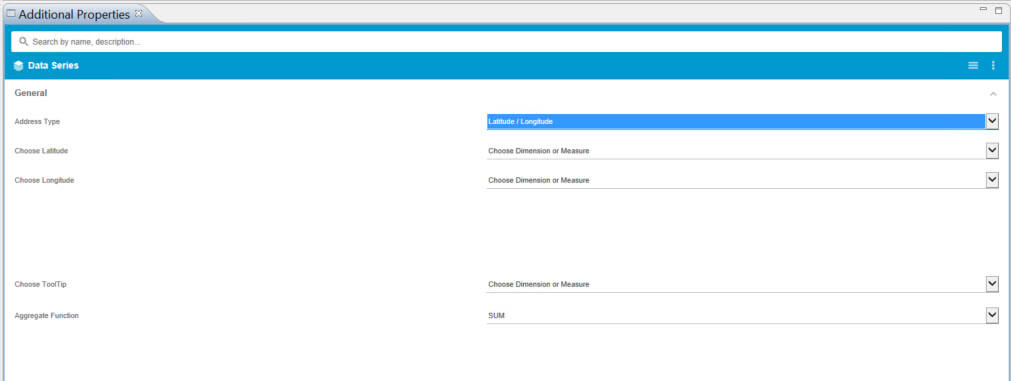
After we added our Location Analyzer component from the Design Studio Extensions to our new SAP BusinessObjects Design Studio project, we can start configuring the details. In the category Data Series, we can decide if we would like to use data based on Longitude and Latitude information or if we would like to hand over complete address information to the component, which then will reverse geocode the data. In regards to the Longitude and Latitude information, the component is able to use the information from dimensions or from measures.
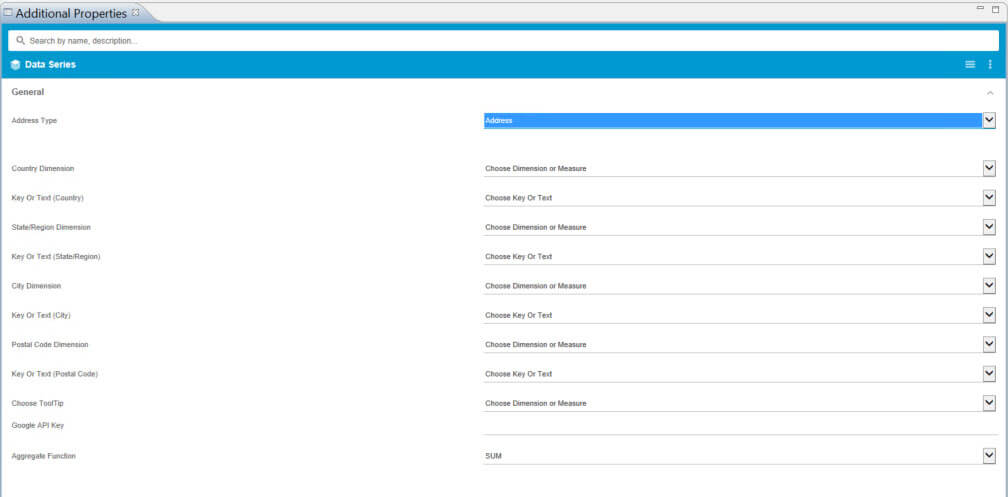
Figure 3 shows the option to provide a complete address as part of the configuration, which then will be used to retrieve the longitude and latitude by reverse geocoding it.
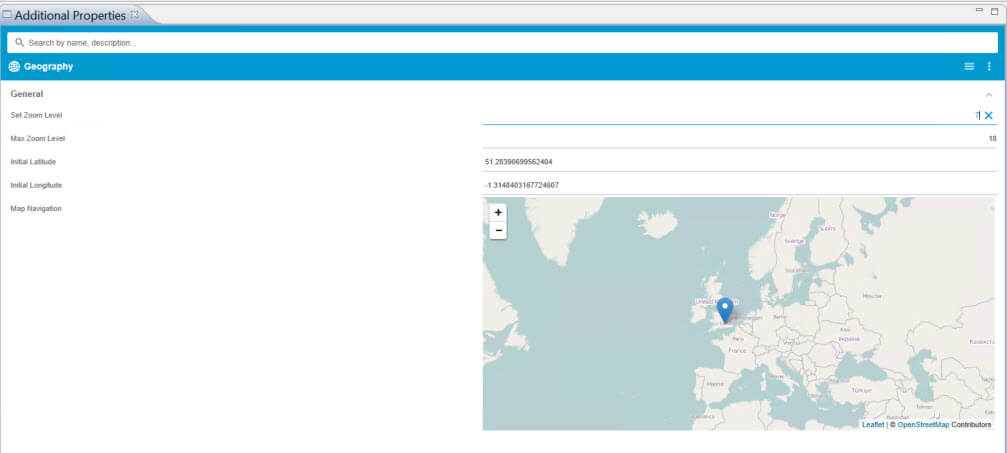
As next step we can configure the initial Zoom Level for the map and we can configure the starting point for our map as part of the overall dashboard. We can configure the starting point by either manually entering the longitude and latitude value or we can simply drag the marker to our starting point.

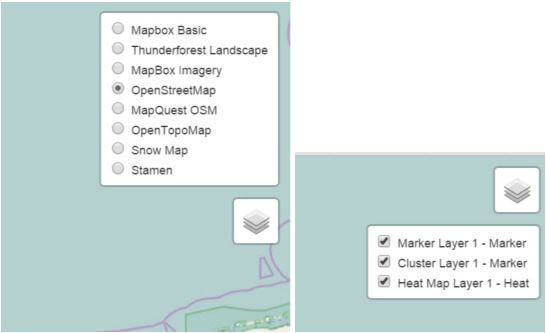
After we configured the zoom level and starting point for the map, we can now navigate to the Map Layers category in the Additional Properties. Here we can activate three different layers: Heat Layer, Cluster Layer, and Marker Layer. In addition we have the option to select the mapping provider and we can enable the user to switch between these mapping providers at runtime as well.

In Figure 6, we can see the details of the cluster layer definition and configure elements such as which zoom level the clustering should be removed. In addition all the layers that we define do have the ability to setup a filter layer based on dimensions from the underlying data source. This feature becomes very helpful as you can now define a map layer to a subset of the original data set. For example, you could configure Product 1 with a blue marker layer and Product 2 with a green marker layer.
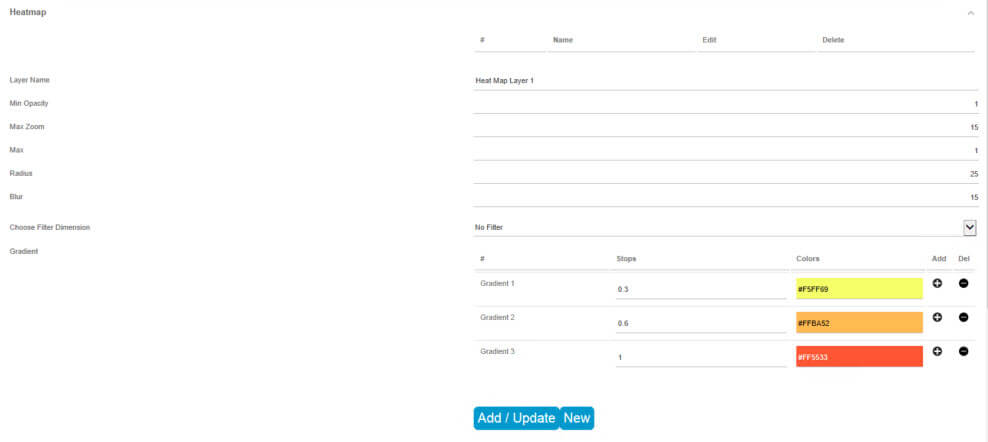
Figure 7 shows the details of the heat layer and the details on the color gradients for the heat layer.

Figure 8 shows the details of the defined marker layer. The user has the option to choose the standard marker symbol or to select a symbol from a list of predefined symbols, such as shown in Figure 12.
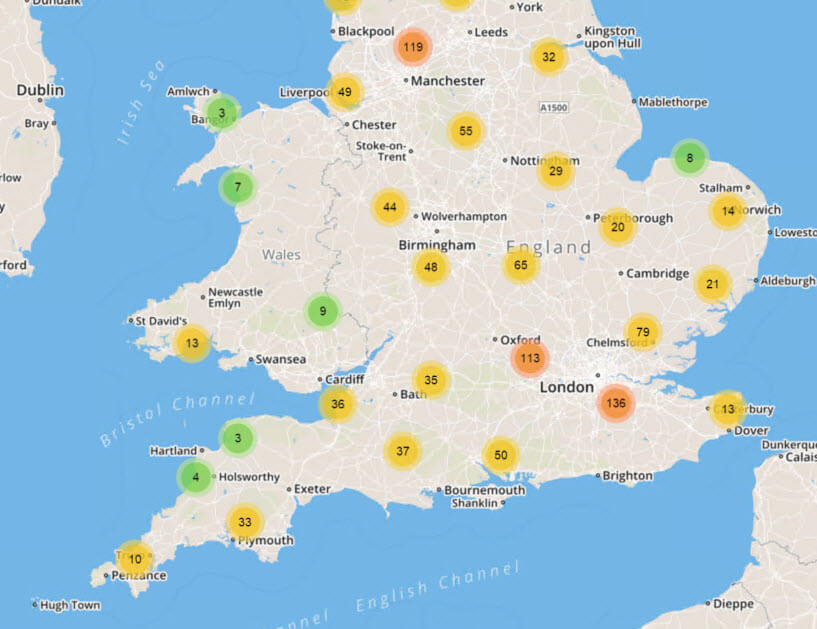
Figure 9 shows the map with the defined cluster layer.
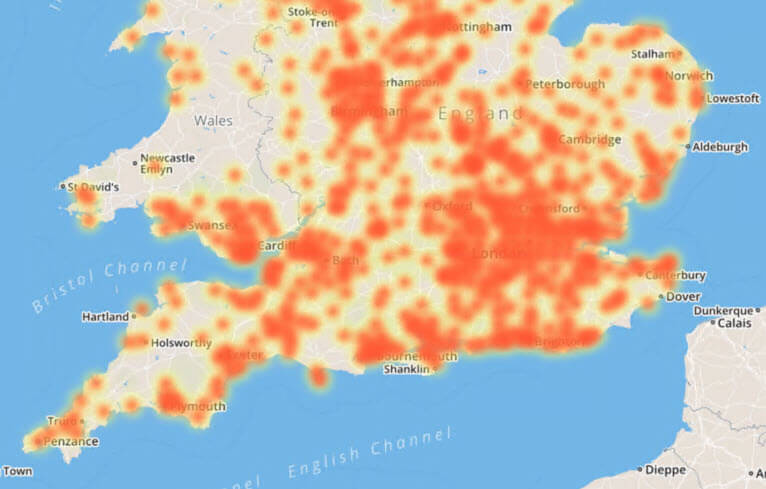
Figure 10 shows the heat layer and Figure 11 shows the marker layer.
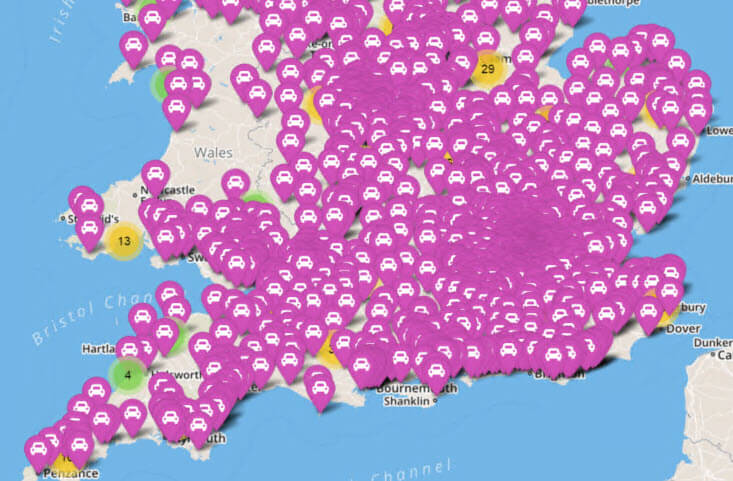
As you can see it was very easy to connect my data source to the component and to setup the different layers. There is no limit in the number of layers and the user does have the option to choose between the different layers and the different mapping options at runtime as shown below in Figure 12.
Last but not least, we also allow you to integrate the data shown on the map with your existing SAP BusinessObjects BI assets.
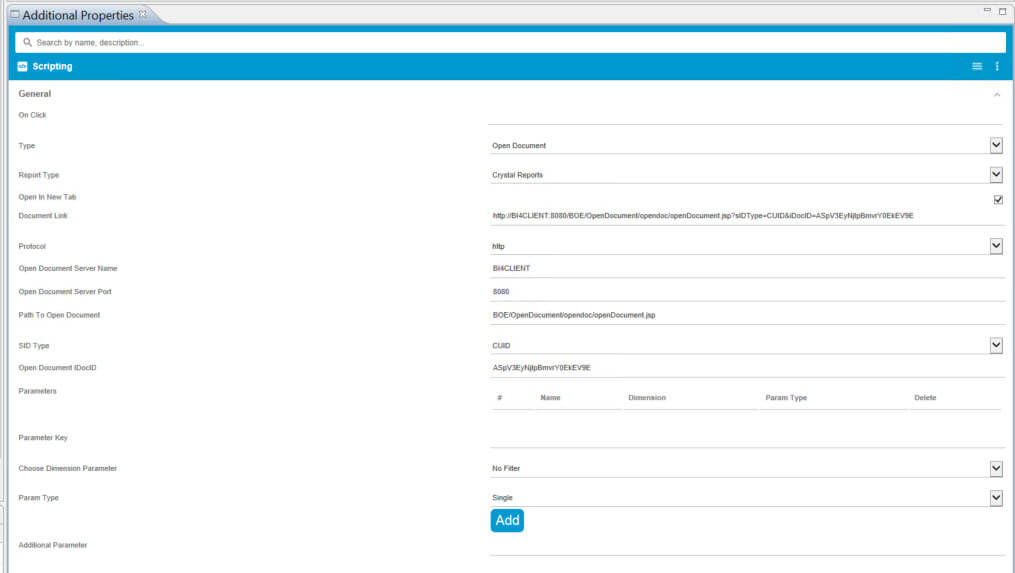
As shown in Figure 14, you can now integrate the map layer with your SAP BusinessObjects BI 4.x system and you can either provide a complete OpenDocument URL or you can enter the different parts of the information and the URL will then be constructed. In addition you choose dimensions from the underlying data source and in that way pass the context from the map to the report (Crystal Reports, Web Intelligence, Analysis OLAP, or Design Studio) as a filter for the report.
As shown in just a few steps, you can connect your data source to the component and quickly configure the different layers for the map as well as integrating any of your existing reports, so that you map can become a starting point for your analytical workflow.
In case you would like to try this with your own data, you simply register for our 30 day trial and after just a few minutes of installation, you can follow these steps and display your very own data onto the map.
