
The Legend of a Chart plays an important role in enhancing the Visualization appeal and Interactive ability of the Chart. Legends are no longer simply static indicators of the data series displayed in the chart but have grown in function to provide customizable selection options to a user viewing the chart.
The VBX suite of charts provides an option by default to de-select a data series by clicking on the legend. But some users might encounter situations where de-selecting a series on-click of legend is not desirable, they might want a different outcome such as highlighting the data series of the legend option which was clicked and de-selecting the remaining data-series (or) greying out the remaining data series. For such custom requirements, VBX Script Box is the go-to component.
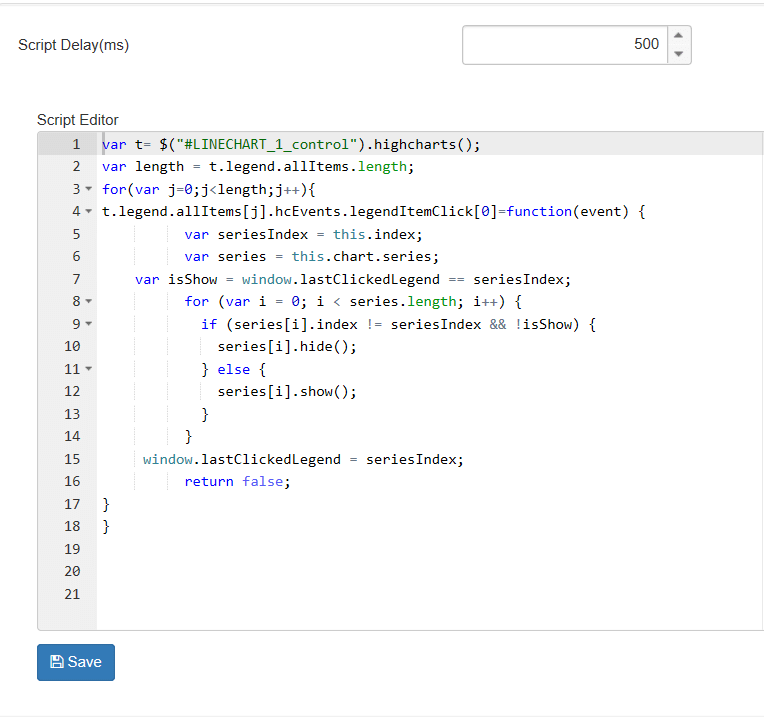
The following code snippet allows you to achieve the scenario as shown in the image above with the help of the VBX Script Box:
Explanation for code
- All properties and data of a chart whose legend event is to be customized are stored as a JQuery object
- Length variable stores the number of legend options available in the chart, we will be using it as an iteration variable
- Each legend option is stored as an array element, so, the event associated with each legend option needs to be re-written, hence the first for- loop where the legend on click event is being modified using a function. (Note: legendItemClick events are stored in an array, hence we can push events to this array as well, but for simplification, we are re-writing the first event which is defined by default. Hence, the function is assigned to legendItemClick[0])
- ‘isShow’ variable is Boolean and is assigned true if the current series index is equal to the series index of previously clicked legend option i.e. if the same legend option is clicked twice consecutively
5.The second for- loop iterates for each series item, if – else condition checks if a series index of the current iteration is equal to the series index of a selected series item in which case it shows the series or else hides it. The ‘isShow’ checks if the same option has been clicked again and in that case, all series are shown
Likewise, this event can be customized to change the selected series color, show/hide the series, highlight the series, etc based on the user’s requirements, thus delivering the expected functionality to the BI user.
The VBX script box can be used to achieve more such customizations to any component available on Lumira Designer. Please follow the below links for a few other interesting scenarios:
Dashboard Hacking with VBX HTML Box for SAP Lumira Designer
Know more about VBX for SAP Lumira Designer here.