
Conditional formatting is a powerful visualization cue used in most dashboards to help the users direct their attention to things that need attention. It enables the user to add color coding and visual cues to help highlight matters of concern or attributes that aren’t going well
There are 2 ways of applying Conditional Formatting:
- Static: Static Conditional Formatting is a scenario where the limits are fixed to static values. One such example would be
Sales > 60K: Good
Sales < 40k: Bad
These values are static (hard – coded) and have to be specified at design time at the component level and cannot be changed during runtime.
- Dynamic: Dynamic conditional formatting is when the limits or rules are based on another measure which cannot be fixed at design time but would depend on the transaction data itself.
One such example would be to benchmark the actuals against targets and targets can vary based on the level of drilldown and a static value for conditional formatting would not apply in this case.
Actuals < Target: Good
Actuals > Target: Bad
The conditional formatting feature in SAP Lumira 2.0 is limited to an extend since users can only perform Static conditional formatting. So, what if the user wanted to compare against dynamic value i.e. values coming from the data source? This is where our VBX comes in
VBX Charts offer robust conditional formatting options where the users can compare against both static and dynamic values.
VBX support the following use cases for Dynamic Conditional formatting
- Single Data Cell – Dynamic
- Single Measure
- Percentage based
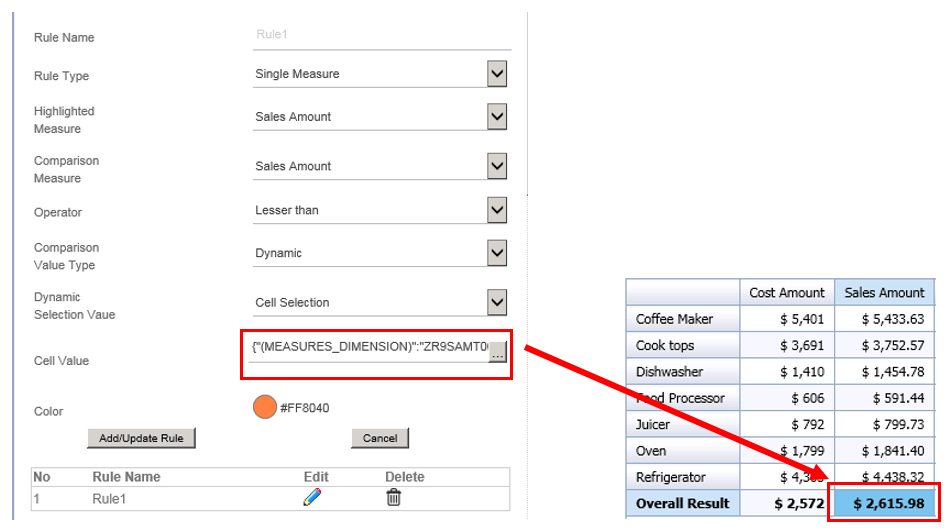
Conditional formatting based on a Single Data Cell
Using VBX extensions, you’re no longer limited to static values for setting chart alerting rules. You can make chart alerting dynamic by binding the threshold value to a data cell within a data source.
A typical example would be to compare sales of a Product against the average sales of all products, such that the Products below the average sales are highlighted in orange.
Here, our Highlighted measure/ Comparison Measure is Sales and Comparison value is a Data cell i.e. Average Sales of All Products
Conditional formatting rule: If Sales < Average Sales: Orange

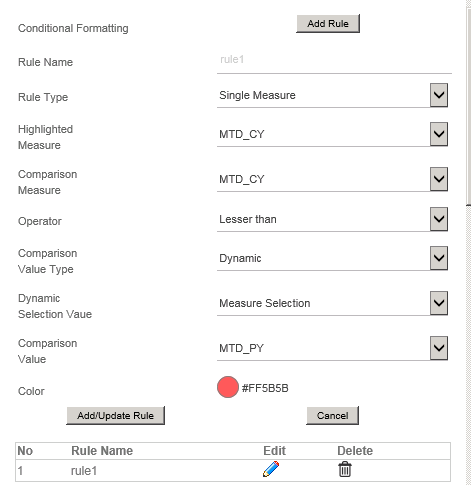
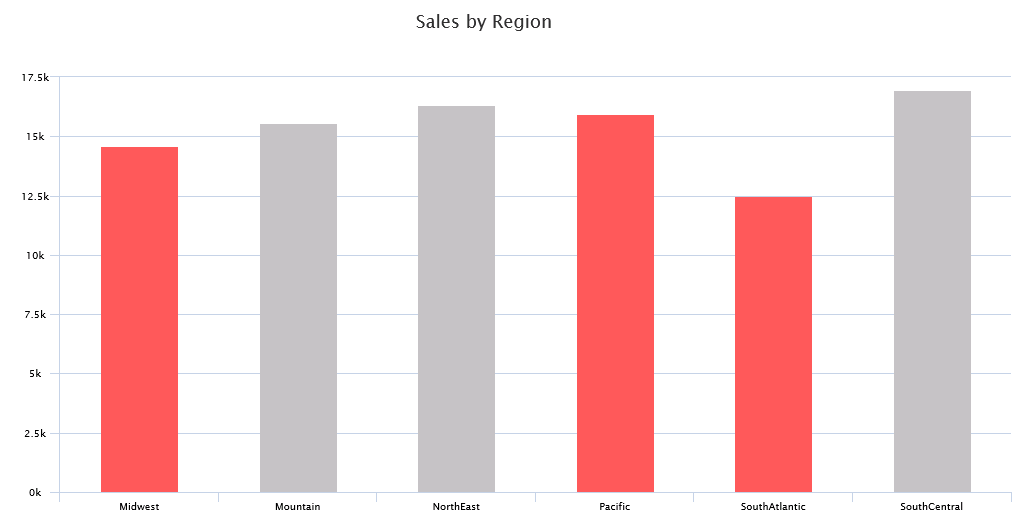
Conditional formatting based on a Single Measure
VBX extensions allows you to set the threshold value based on measures defined within a data source. This helps you dynamically set the thresholds for each dimension values.
Example, let’s say you want to highlight Product Categories where Sales has dropped as compared to the previous period. As seen from the data each product category has a different target values. Here, our Highlighted measure/ Comparison Measure is Actual Sales and Comparison value is Previous Year Sales
Data
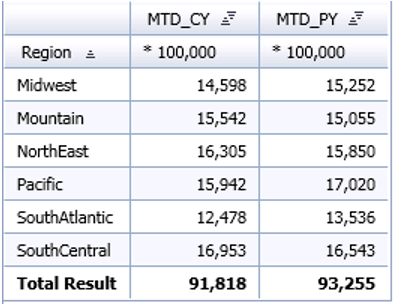
Conditional formatting rule: If Current Year Sales < Previous Year Sales: Red
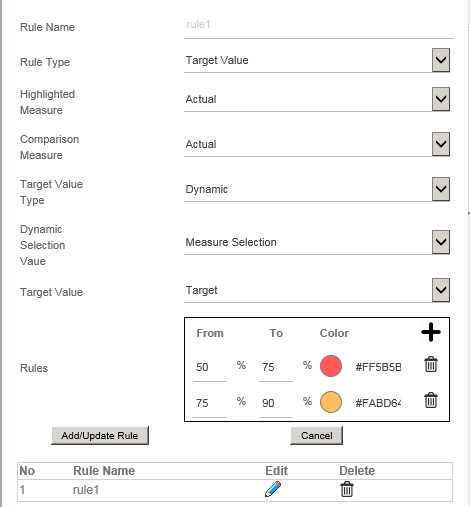
Percentage based conditional formatting
VBX extensions allows you to set the conditional formatting based on percentage of the Target Value achieved.
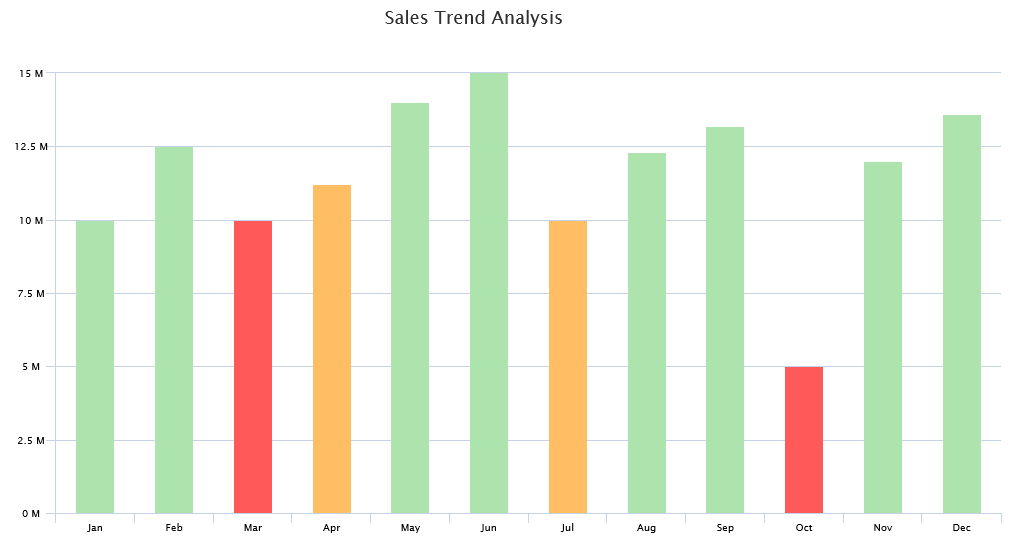
Consider an example where you want to dynamically highlight Months based on the percentage Target achieved. Here, our Comparison Measure is the measure Actual Sales and our Target is Target Value
Data
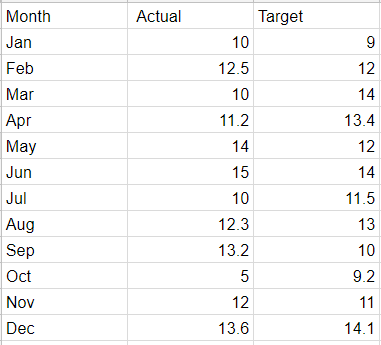
Conditional formatting rule: If Actual has achieved 50% – 75 % of Target: Red
If Actual has achieved 75% – 90 % of Target: Orange
If Actual has achieved 90% + of Target: Green
Using VBX for SAP Lumira Designer one is not just limited to charts for conditional formatting but our Maps, Selectors and utility also provide advanced conditional formatting features.
For more information on conditional formatting in Maps checkout the following links:
Conditional formatting on a Map in Design Studio
Conditional formatting for Maps in SAP BusinessObjects Design Studio
Click here to download a FREE 15-day trial of VBX for SAP BusinessObjects Design Studio/SAP Lumira Designer.