
This is part of the VBX Geo Mapping Capabilities blog series.
One of the frequently requested features for spatial analysis in SAP Lumira Designer is the capability to create drill down Geo Maps. In the earlier blog, we talked about how to Create Custom Maps in SAP Lumira designer . Now let’s look at how to Create Drilldown Geo maps in SAP Lumira Designer using VBX, where one could drilldown from one Map level to another level of details. e.g. Drilldown from a County to a State.
This can be done by using both the standard SAP Lumira Designer maps as well our VBX Geo Heat/Bubble Map, however VBX Maps offers a seamless interface and makes the designing process a lot faster and easier without the need of scripting and other customization.
Drilldown in maps is handled using map layers where, in each map layer provides one level of drilldown. Currently the VBX Maps provide 3 map layers which means that you can drilldown 2 levels deep from the initial map layer. Apart from this, VBX also offers you the functionality of having a Z Axis which allows you to overlay non-geographic information on the map. This means that you could drilldown from a Continent to a Country to a State level and if required can also display additional non-geographic information using the Z axis option.
Z Axis
The following are some of the features you would gain with using VBX Maps:
- One click drilldown without the need of scripting
- Ability to automatically read different data inputs like Region names, Geo key, Postal codes, FIPS code etc. without the need of GeoJSON
- Built in 30+ base map layers – Google, ESRI, Open street
- Built in 400 different mapping types e.g. Maps for specific countries and their states, congressional maps etc.
- Built in robust Conditional formatting options – Dimensions / Measures both Static and Dynamic
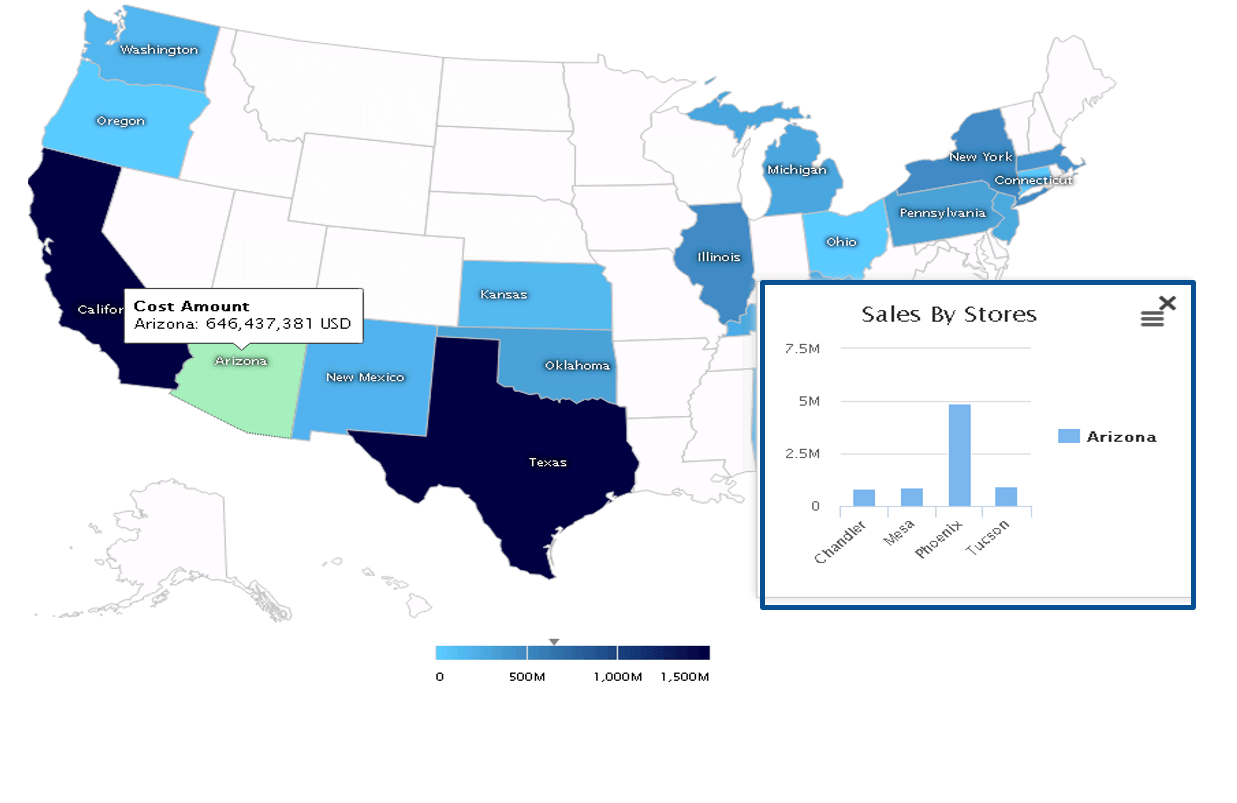
- Z axis – Ability to display additional non-geographic information
- Tooltip and Data Label customization – Ability to add additional dimensions/measures and images
- Open doc URL integration – one click drilldown to Webi, Crystal and AO reports
Drilldown Map using VBX Geo Heat/ Bubble Map
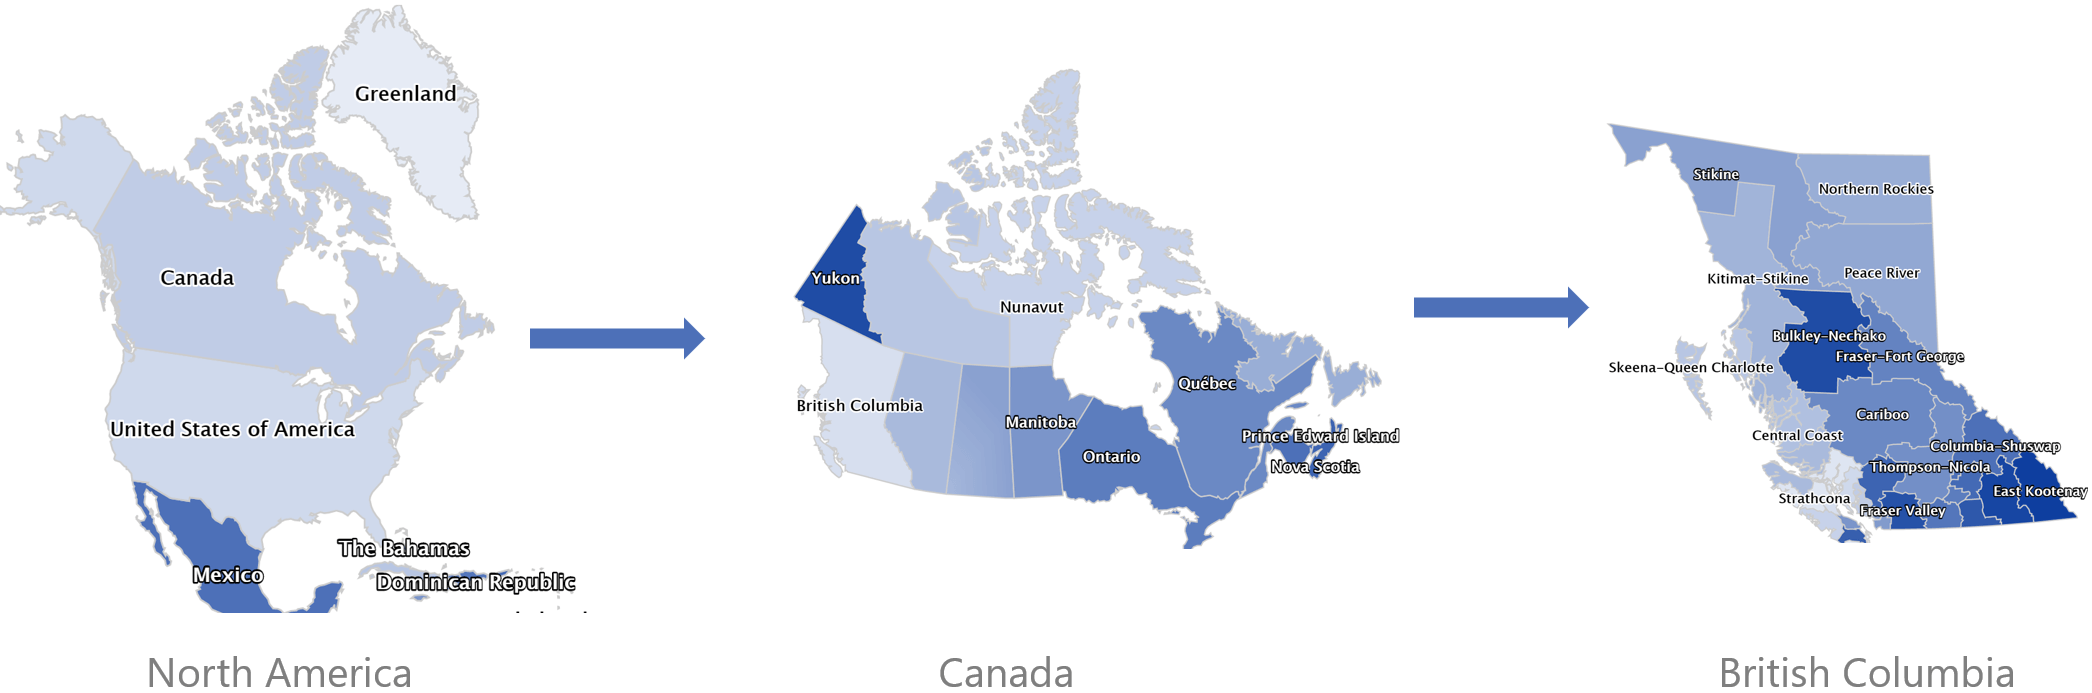
So, let’s consider an example where, as a senior executive you would like to monitor the performance of different regions. One of the ways of doing this would be by using drilldown Maps where you could drill down from Continents to Country level.
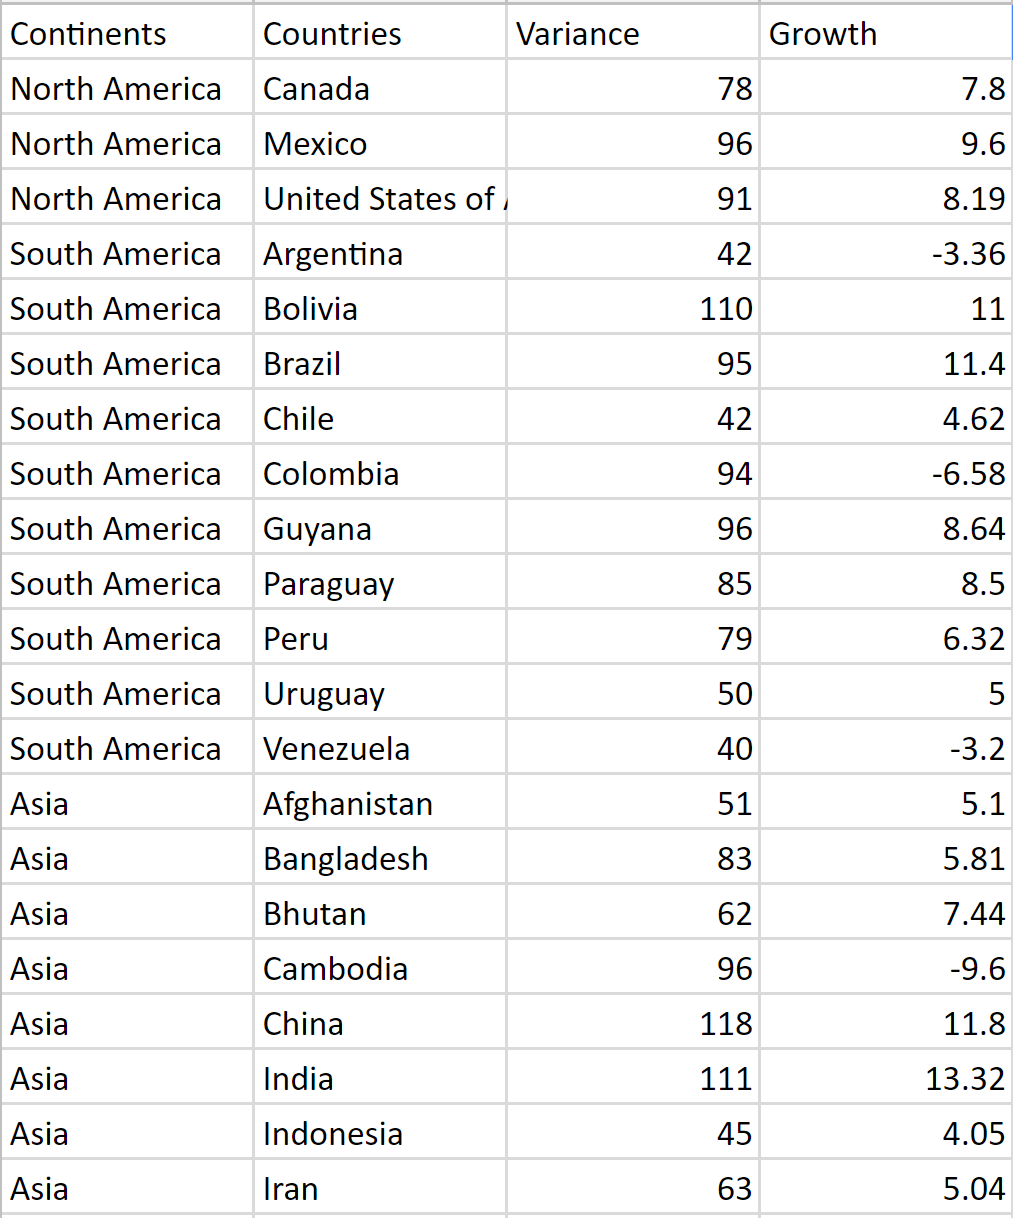
Step 1: Drag the VBX Geo Heat/ Bubble Map to your canvas and connect it to the data source containing the geo-spatial data.
Sample Data
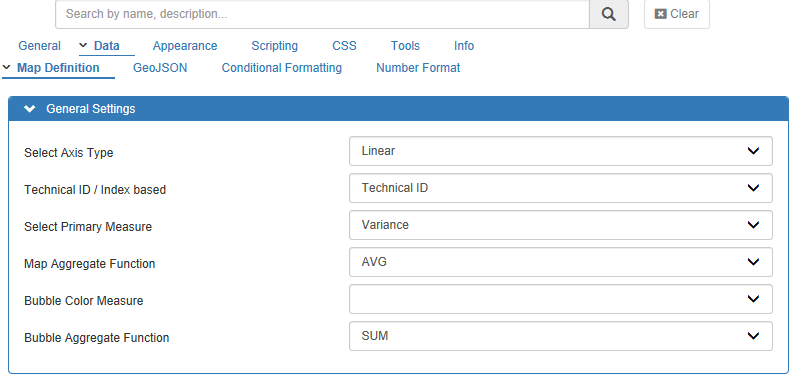
Step 2: Setup the Map Definition
- Navigate to the Data tab and select Map Definition
- Depending on your data you can either select a linear scale or logarithmic scale.
- Next, set the primary measure and its aggregation type
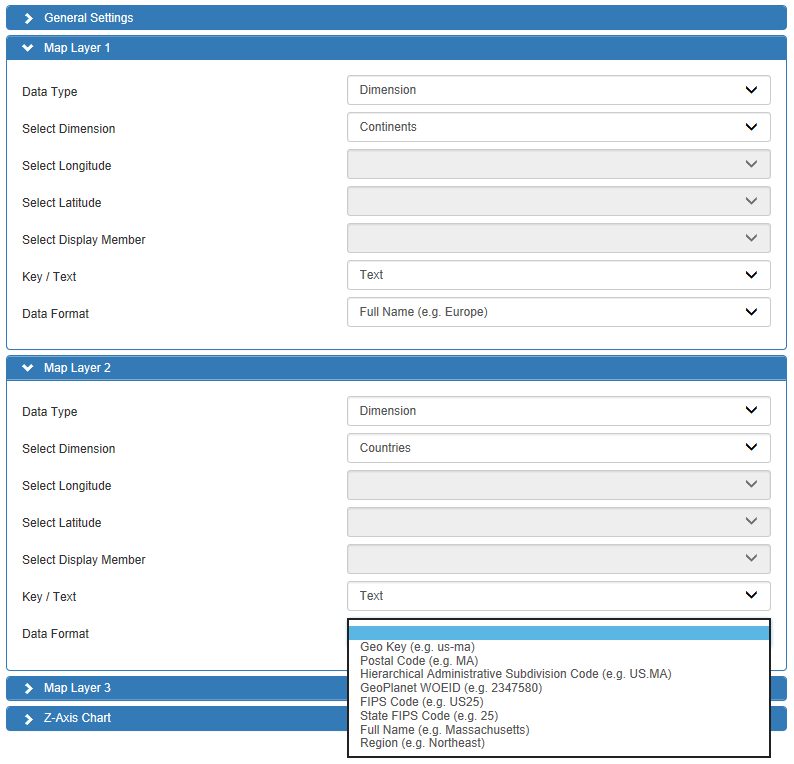
Step 3: Setup the different drill down layers in the order you want to drill down
- Map Continents to Map Layer 1, as we want that to be our first layer.
- Select the Key/text format and the data format based on your data definition.
- Repeat the same for the next layer i.e. Country
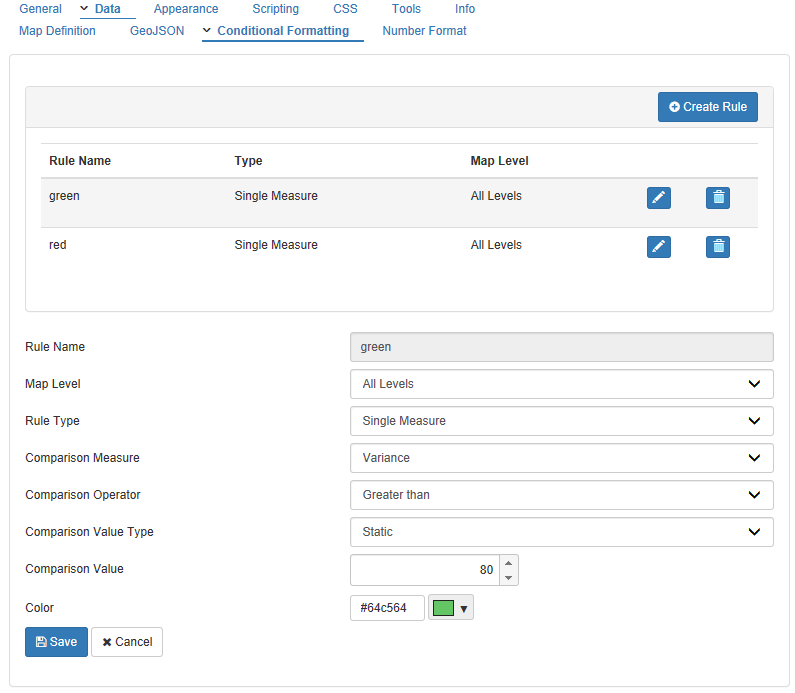
Step 4: The last step is to assign different colors to your regions, which can do by either by assigning a min/max color range for your heatmap or by using conditional formatting. In our example, we will be using conditional formatting to color code regions based on the Variance% from their Target such that
Red – if Variance% is < 60
60 Green – if Variance% is > 85
Orange – if Variance% is between 60 and 85
Finally, our Drilldown Variance Analysis Geo map is ready!
Click here to download a FREE 15-day trial of VBX for SAP BusinessObjects Design Studio.