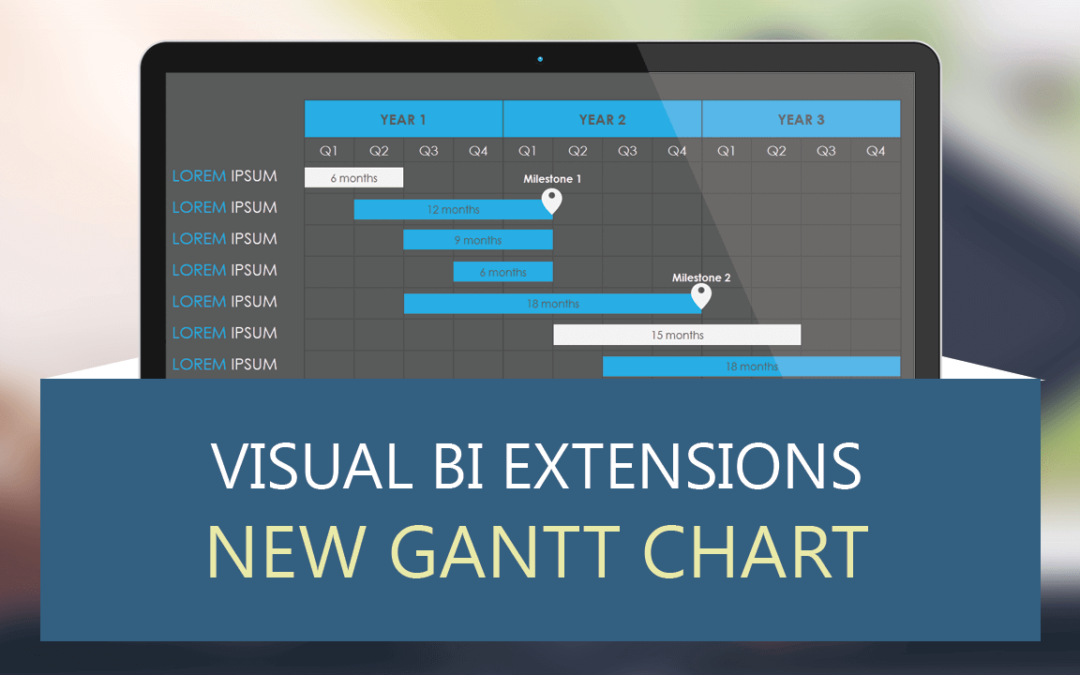
With the latest edition of our VBX, we also added a new Chart type for SAP Lumira Designer : a Gantt Chart.
So lets go ahead and build a new Gantt Chart in SAP Lumira Designer. Lets assume we have a data set that looks similar to this:
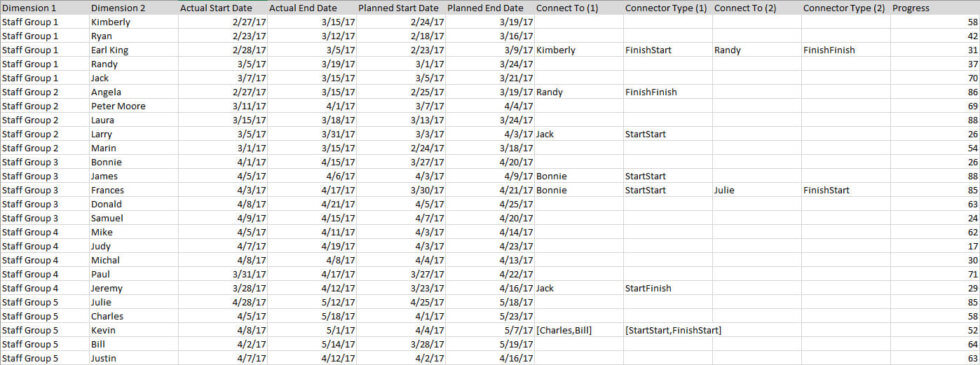
As you can see, we have the date values for the Actual Start and End as well as the Planned values, and we have the details on how we want to “connect” the individual tasks (more to that later).
After we added the data source to our SAP Lumira Designer project, we add the new Gantt Chart component and take a look at the Additional Properties.
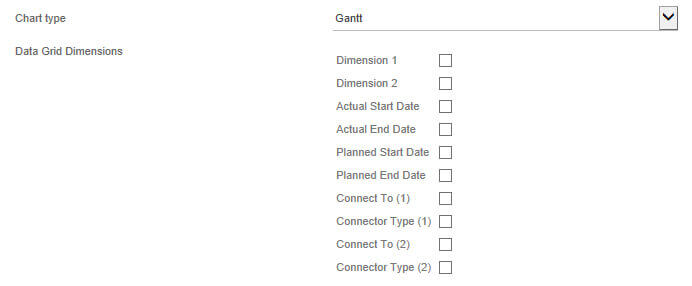
As the first step, we configure the Chart Type, which in our case is “Gantt” (the chart also supports Resource type charts) and we can then select which elements we would like to display in the “Data Grid” of the chart. The data grid is the “left” side of the chart with a table displaying the information.
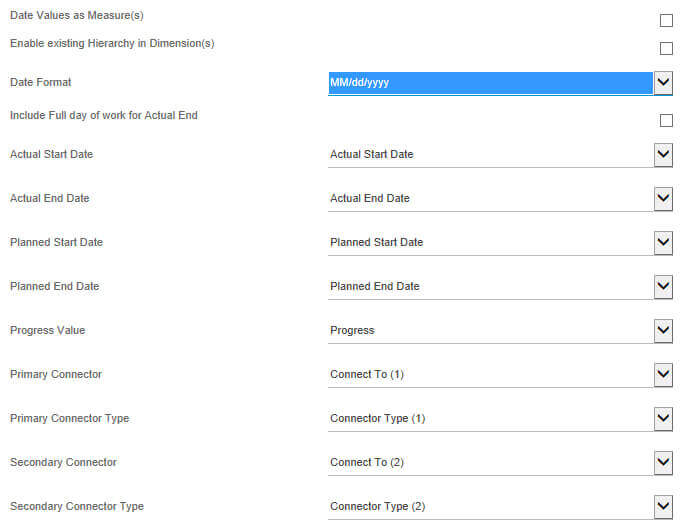
After selecting the dimensions for our Data Grid, we can then map the elements from our Data Source to the elements of the Gantt Chart. First we check if the date values in the data source are available as dimension or measures, and we can set the date format – in our case MM/DD/YYYY – for our data source.
In addition, we then map the dimensions from our data source to the elements of the chart itself.
So here we do have the information to also map our connector information, which then will link individual tasks, for example : Task 2 can only start when Task 1 is complete and Task 3 has started. As you can see in our sample data set we have several connectors with those conditions defined.
After we configured the elements, we have our Gantt Chart:
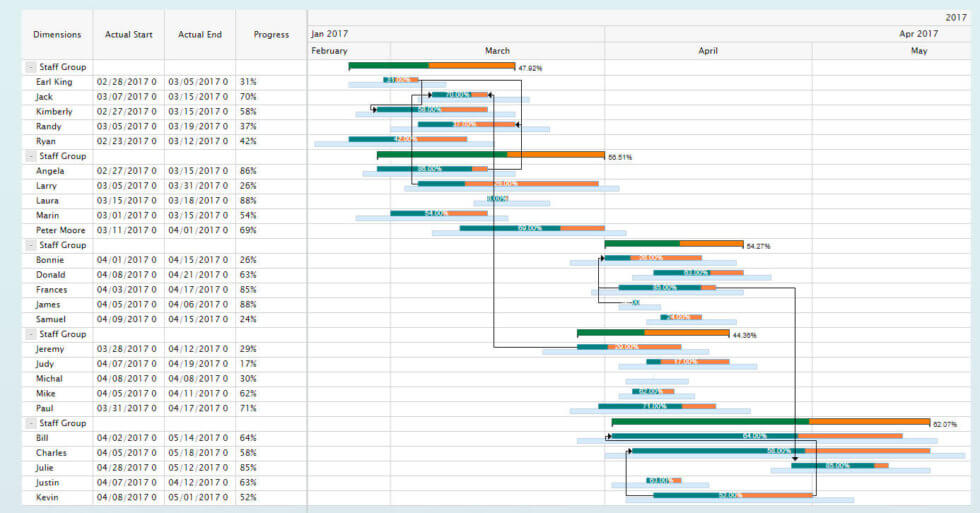
The dimensions from our data set are automatically available for expand / collapse interactively.
We see all the connectors being configured and we can see the Actual progress (shown in green and orange) as well as the Planned values (shown in light blue).
In case you are interested to use a Gantt chart as part of your next project with Design Studio, register for our Trial and use the Gantt Chart with your own data.