
One of the effective ways of highlighting important information or driving people’s attention towards the pain points is by using Reference bands in charts.
In the earlier blog, we discussed about The importance of Reference Bands and Lines. Now, let’s us see how easy it is to create one in SAP Lumira Designer leveraging VBX.
Implementing Reference Bands – Fixed Limits in a Chart
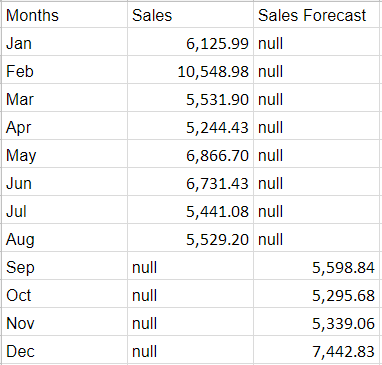
Sample Data
Consider the following sample data, which lists Sales till the current reporting month along with the forecasted values.
We will be using Plot bands to highlight the Forecasted values from the Actuals. Assuming that you have already configured the VBX Column chart with the Data, let’s get started…
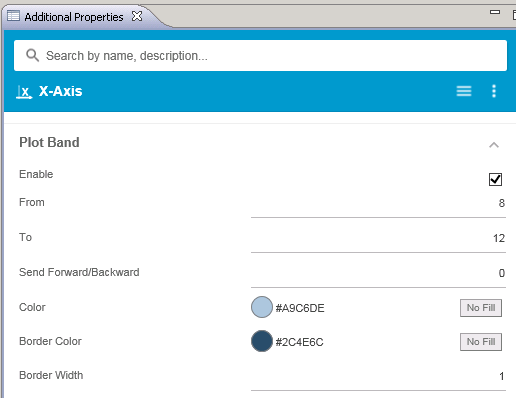
Step 1: Navigate to the additional property sheet and select X Axis Tab from the Menu option. Scroll down to the Plot band property and configure the following properties.
- Tick the checkbox to enable the Plot Band
- Define the range of the Plot Band (From= 8, To= 12 in the example below)
- Set the color of the Plot Band (light blue – ‘#A9C6DE’ in the example below)
- You could further style it using the border color and width property (Color= dark blue ‘#2C4E6C’ and width=1 in the example below)
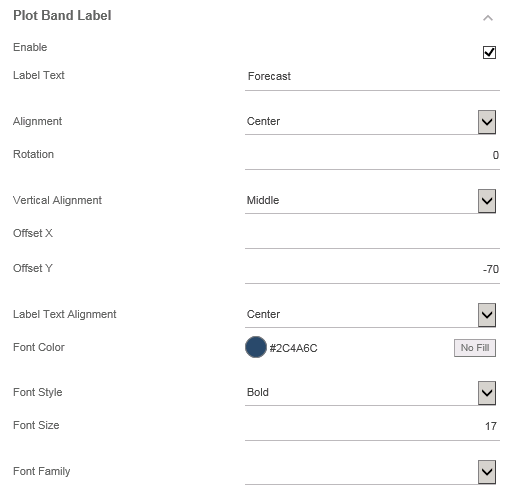
Step 2: Next, we need to provide a label to the plot line
- Tick the checkbox to enable the Plot line label
- Set the label text (‘Forecast’ as seen below)
- Align the labels. If required, you could use the X and Y offset settings for better positioning (vertical alignment= Middle and Horizontal alignment= Center)
- Font properties (color, style, font size and family)
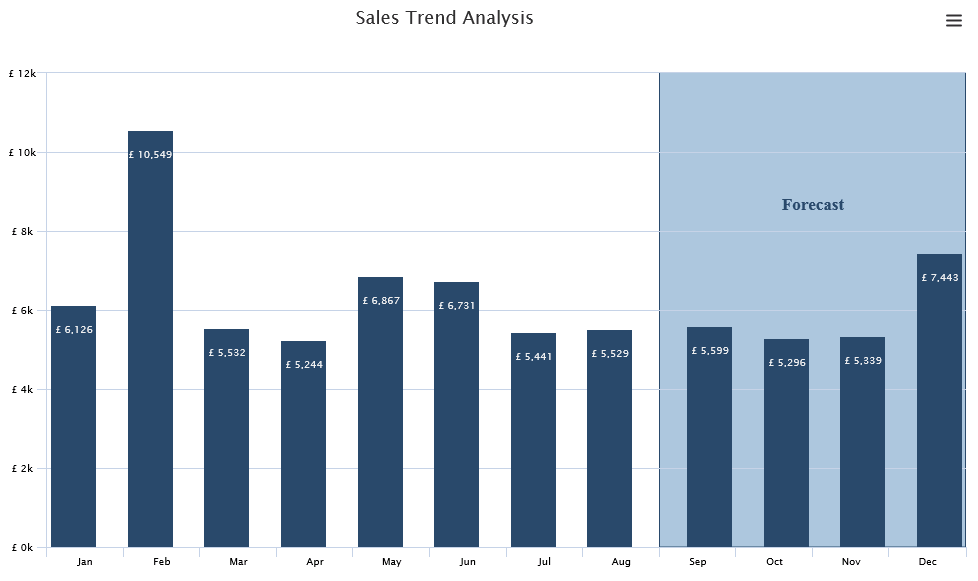
Voila! VBX Column chart with Plot Band is ready
Dynamic Reference Bands
There are a couple of use cases, where you would like to change the Plot band dynamically. For example, based on the actual month you would like the position of the plot band to change in order to highlight the forecasted months. This could be achieved using the following VBX for SAP Lumira Designer (VBX) APIs
DSXSetXAxisPlotBandFrom(value) – Set the start value of the Plot band range
DSXSetXAxisPlotBandTo(value) – Set the end value of the Plot band range
Some of the other formatting properties are as follows:
DSXsetXAxisPlotBandEnabled(value) – Enable/ Disable the Plot Band
DSXSetXAxisPlotBandColor(value) – Assign color to the plot band
In the next blog, we will be looking at Implementing Reference bands with Variable limits in SAP Lumira Designer . So, stay tuned….
Click here to download a FREE 15-day trial of VBX for SAP BusinessObjects Design Studio/SAP Lumira 2.0.