by Bhupinder Singh | Apr 18, 2018 | Extensions, SAP Lumira Designer, VBX Product Extensions
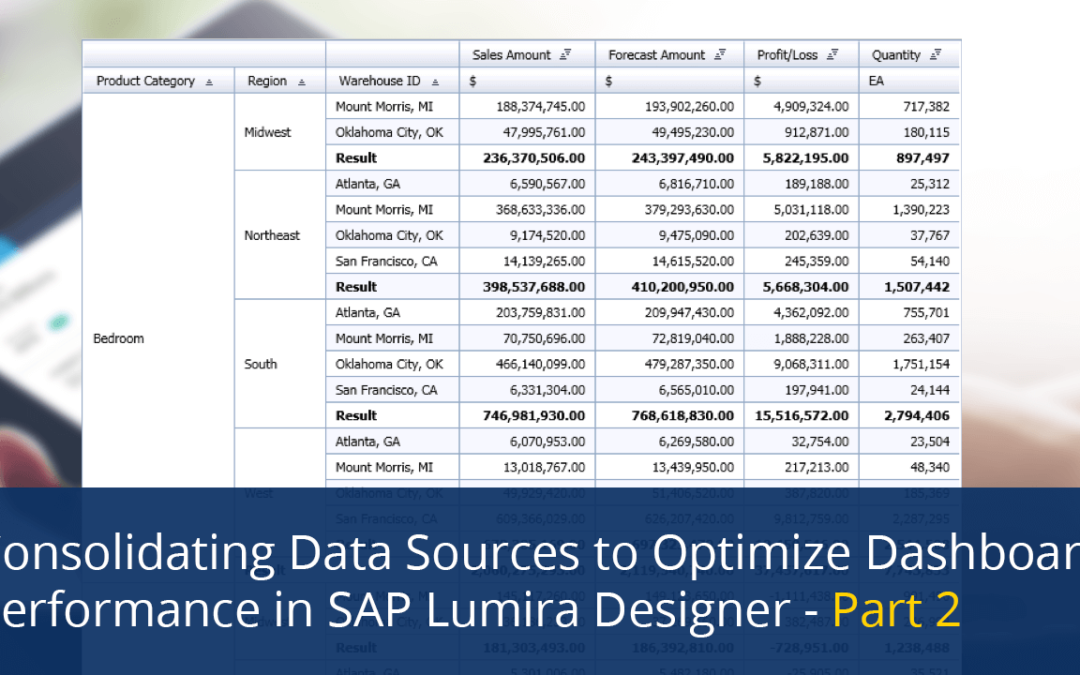
In an earlier blog, we discussed about enhancing the SAP Lumira Designer application performance by reusing data sources with the help of the ‘Data Utility’ property for Visual BI extensions(VBX) Charts. The Data Utility property is not limited to VBX charts, our...
by Devaraj NS | Apr 11, 2018 | Extensions, VBX Product Extensions
We are glad to share a sneak peak into our upcoming version of VBX for SAP BusinessObjects Design Studio / SAP Lumira. In case you are not familiar with our Extensions yet, you can find some introduction material here VBX Extensions. Our Extensions are grouped into...
by Lumel | Apr 10, 2018 | SAP Lumira Designer, VBX Product Extensions
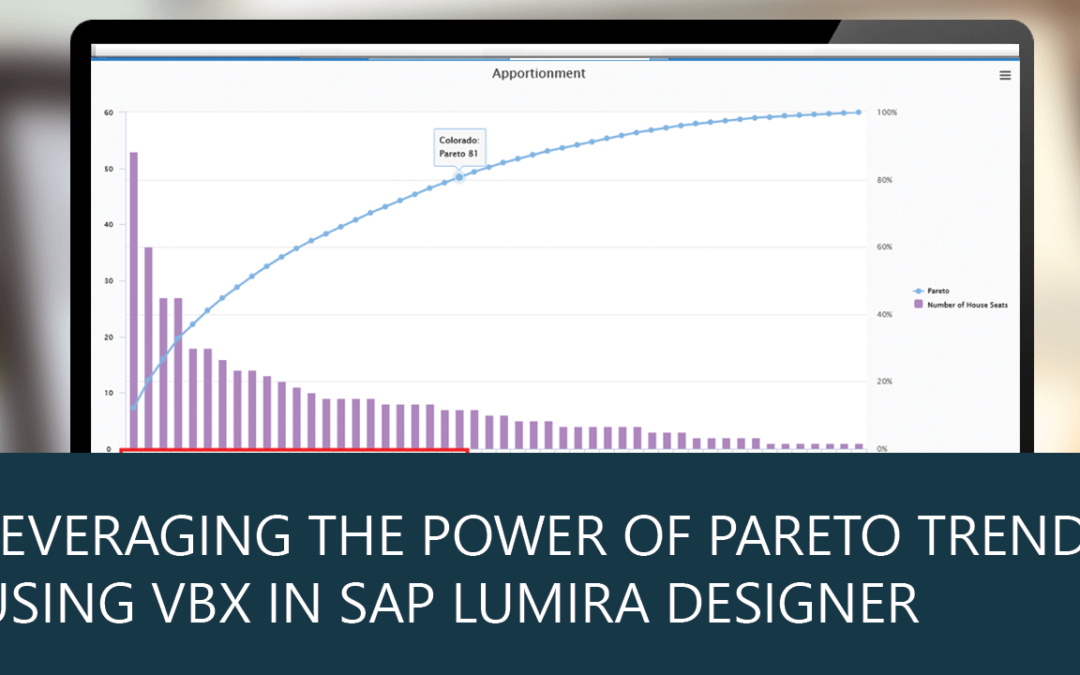
The concept of uneven distribution was first introduced by Vilfredo Federico Damaso Pareto. He stated that 80% of Italy’s wealth belonged to 20% of the population, and on further research, this theory applied to many other scenarios. This led to a generalized notion...
by Bhupinder Singh | Apr 5, 2018 | Business Intelligence, SAP Lumira Designer, Tooltip and Data Label Customization, VBX Product Extensions
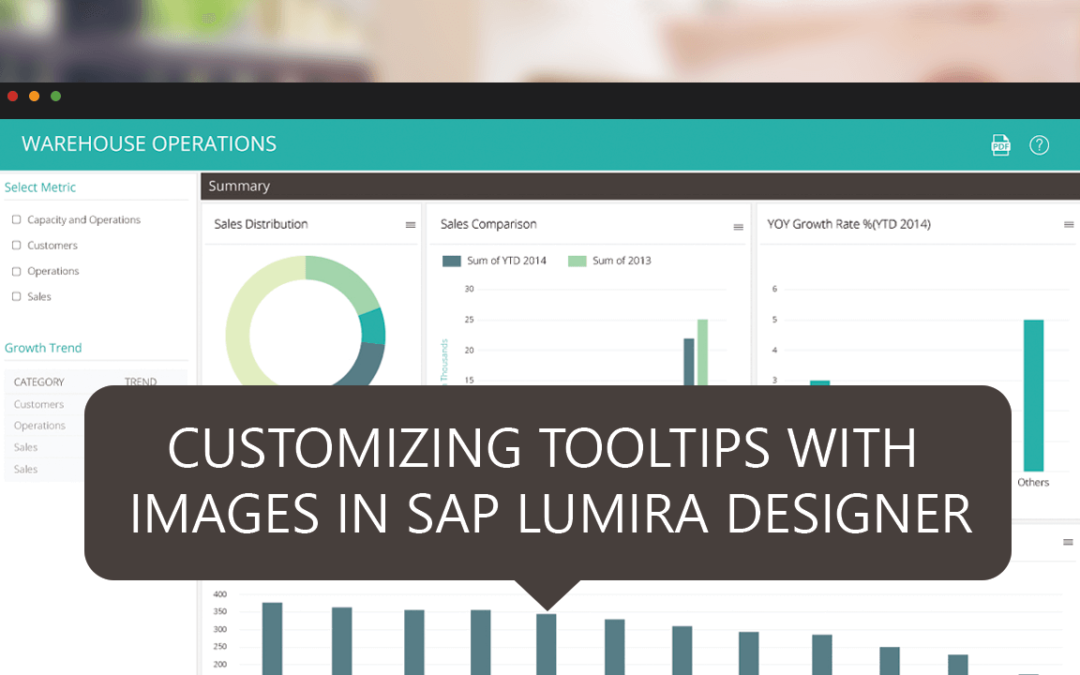
This blog on customizing Tooltips is part of the Tooltip and Data Label Customization blog series. Tooltips help in providing end-users with additional information while effectively utilizing the real estate available. They declutter your visualization and provide a...

by Bhupinder Singh | Apr 2, 2018 | Business Intelligence, SAP Lumira Designer, VBX Geo Mapping, VBX Product Extensions
This is part of the VBX Geo Mapping Capabilities blog series. One of the frequently requested features for spatial analysis in SAP Lumira Designer is the capability to create drill down Geo Maps. In the earlier blog, we talked about how to Create Custom Maps in SAP...
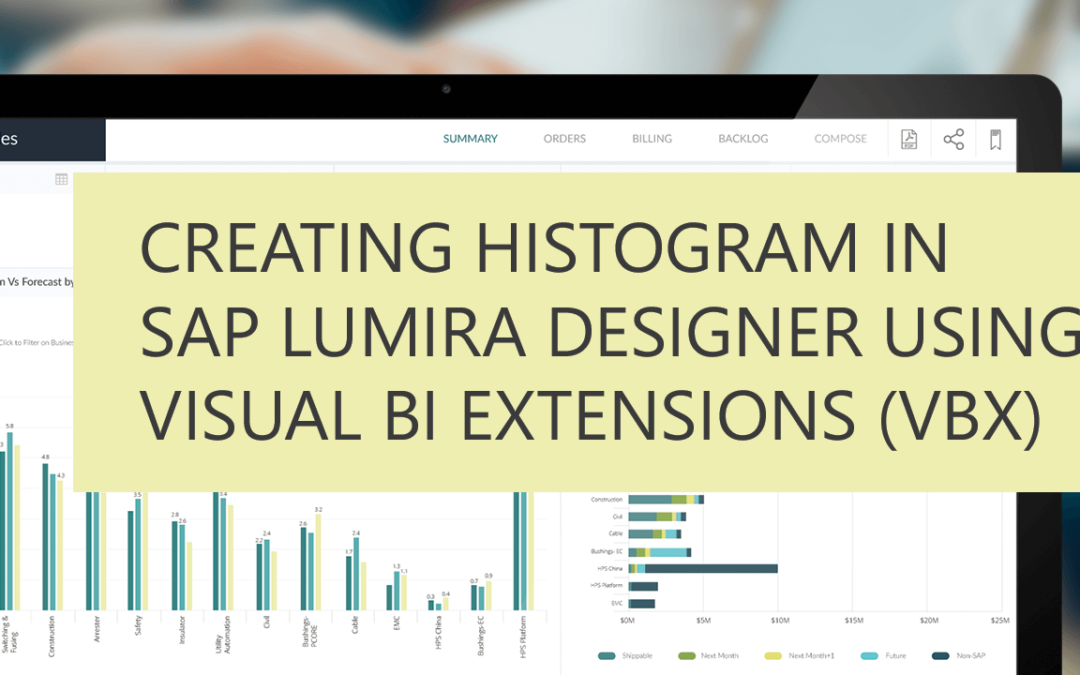
by Lumel | Mar 18, 2018 | VBX Product Extensions
Histogram is an effective way to display the frequency distribution of measures across a continuous data set. They offer an intuitive way to analyze large amounts of data. While a Histogram is used to plot the frequency of occurrence of data across a continuous data...