by Bhupinder Singh | Sep 29, 2021 | Lumira 2.0, SAP BusinessObjects Design Studio, SAP Lumira, SAP Lumira Designer, VBX Product Extensions
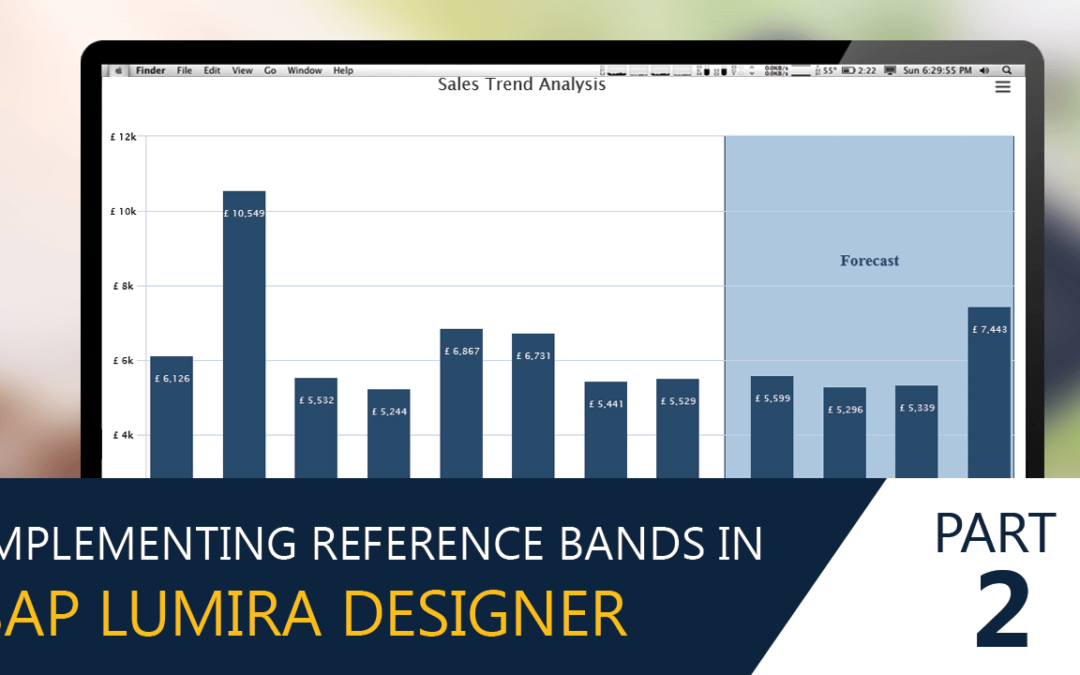
One of the effective ways of highlighting important information or driving people’s attention towards the pain points is by using Reference bands in charts. In the earlier blog, we discussed about The importance of Reference Bands and Lines. Now, let’s us see how...

by Bhupinder Singh | Sep 29, 2021 | Custom Add-Ons, Lumira 2.0, SAP BusinessObjects Design Studio, SAP Lumira Designer, Tips and Tricks, VBX Product Extensions
In the earlier blog we looked at Implementing Reference Bands having fixed limits in SAP Lumira Designer Now let’s look at creating Reference bands for Variable Limits. Implementing Variable Limits Reference Band in a chart Sample Data Consider the...

by Bhupinder Singh | Sep 29, 2021 | Business Intelligence, Extensions, Lumira 2.0, SAP BusinessObjects Design Studio, SAP Lumira Designer, Tips and Tricks, Tips and Tricks, VBX Product Extensions
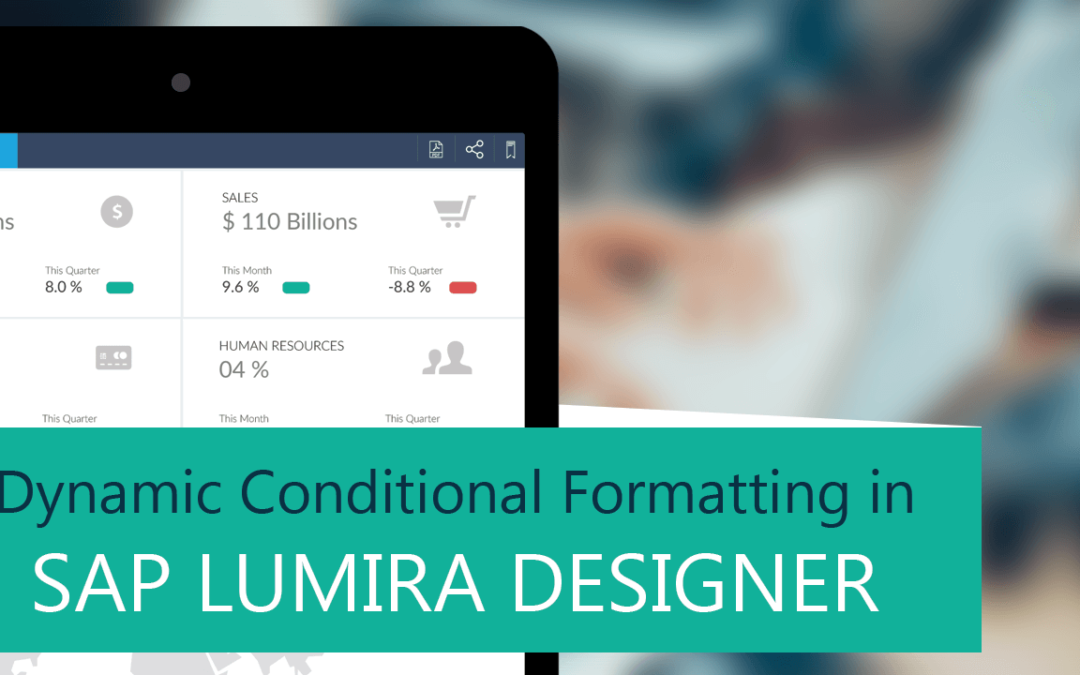
Conditional formatting is a powerful visualization cue used in most dashboards to help the users direct their attention to things that need attention. It enables the user to add color coding and visual cues to help highlight matters of concern or attributes that...

by Bhupinder Singh | Sep 29, 2021 | Business Intelligence, Custom Add-Ons, Custom Component, Extensions, Lumira 2.0, SAP BusinessObjects, SAP BusinessObjects Design Studio, Tips and Tricks, Tips and Tricks, VBX Product Extensions
At VBX, we are constantly tasked with unique visualizations requested by our customers which challenge the boundaries of what is possible in standard SAP Design Studio/ SAP Lumira Designer. This often leads to a mashup of Standard SAP Lumira Designer and VBX to...

by Bhupinder Singh | Sep 29, 2021 | Extensions, Lumira 2.0, SAP BusinessObjects, SAP BusinessObjects Design Studio, SAP Lumira Designer, VBX Product Extensions
Column charts might not be the ideal use case for all scenarios, especially when you have values that are very close to each other, it becomes very hard to visualize the difference between the columns. Another option and a compelling visual for the same would be...


