VBX
  • Components
    • charts-iconCharts – ~50+ dynamic and unique charting options
    • maps-iconMaps – location analytics with 200+ mapping options
    • selectors-iconSelectors – Patented filters & controls to slice & dice on the fly
    • utilities-iconUtilities – Print, export & presentation options
    • speciality-iconSpecialty – Gantt Chart and Data Utility options
  • Pricing
  • Resources
    • sap-lumira-designer-vbx-extensions-resources-whats-includedBlogs – Get insights into VBX with our blogs
    • WebinarsWebinars – Browse through our vast archive of webinars
    • sap-lumira-designer-vbx-extensions-resources-galleryGallery – A gallery for you to explore all VBX components
    • resources-faqFAQ – Get your frequently asked questions answered
    • sap-lumira-designer-vbx-extensions-resources-videosVideos – Browse through our collection of assorted videos on VBX
    • sap-lumira-designer-vbx-extensions-resources-attributionDownloads – Browse through our download items
    • resources-case-studiesCase Studies – Read through our case studies for an in-depth know how of VBX
    • sap-lumira-designer-vbx-extensions-resources-release-notesAttributions – Attribution to the developers and their licensed scripts
  • DOWNLOAD FREE TRIAL
Consuming Excel Data In Enterprise Dashboards – An Introduction

Consuming Excel Data In Enterprise Dashboards – An Introduction

by Lumel | Sep 29, 2021 | Business Intelligence, Dashboards, Data Discovery, Extensions, SAP BusinessObjects, SAP BusinessObjects Design Studio, VBX Product Extensions

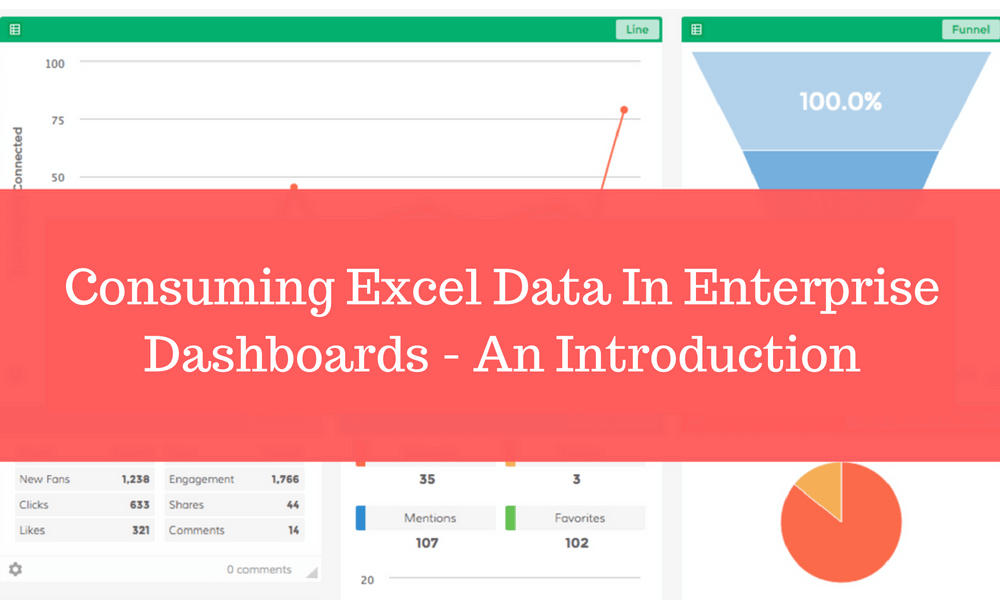
Microsoft Excel is the most popular and dominant data analysis tool used by organizations today. Consequently, there is a huge demand from business users to not only download and analyze enterprise data offline but also prepare, provision and integrate excel...
Consuming Excel Data In Enterprise Dashboards – Deep Dive

Consuming Excel Data In Enterprise Dashboards – Deep Dive

by Lumel | Sep 29, 2021 | Business Intelligence, Custom Add-Ons, Dashboards, Extensions, SAP BusinessObjects, SAP BusinessObjects Design Studio, VBX Product Extensions

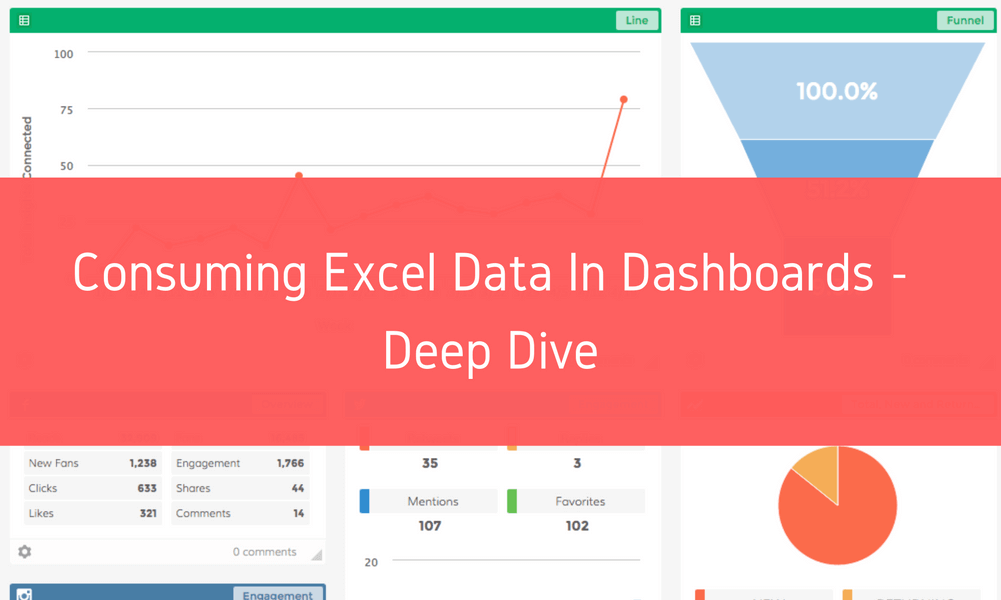
As discussed in my previous blog, there are three ways that facilitate consumption of excel data in enterprise dashboards and visualizations: BW Workspaces which hold the excel sheet and this is then consumed from within SAP Design StudioSAP BusinessObjects...
A Social SAP Design Studio Application

A Social SAP Design Studio Application

by Sindhu Shankar | Sep 29, 2021 | Dashboards, Extensions, SAP BusinessObjects Design Studio, VBX Product Extensions

Even wondered if & how you could build an SAP Design Studio application that would contextually pick up social trends, say for a particular Product Category or Brand from within a Sales Dashboard? The HTML Box & Script Box controls from VBX for SAP Design...
Enhanced PDF Export for SAP Business Objects Design Studio

Enhanced PDF Export for SAP Business Objects Design Studio

by Lumel | Sep 29, 2021 | Custom Add-Ons, Dashboards, Extensions, SAP BusinessObjects Design Studio, VBX Product Extensions

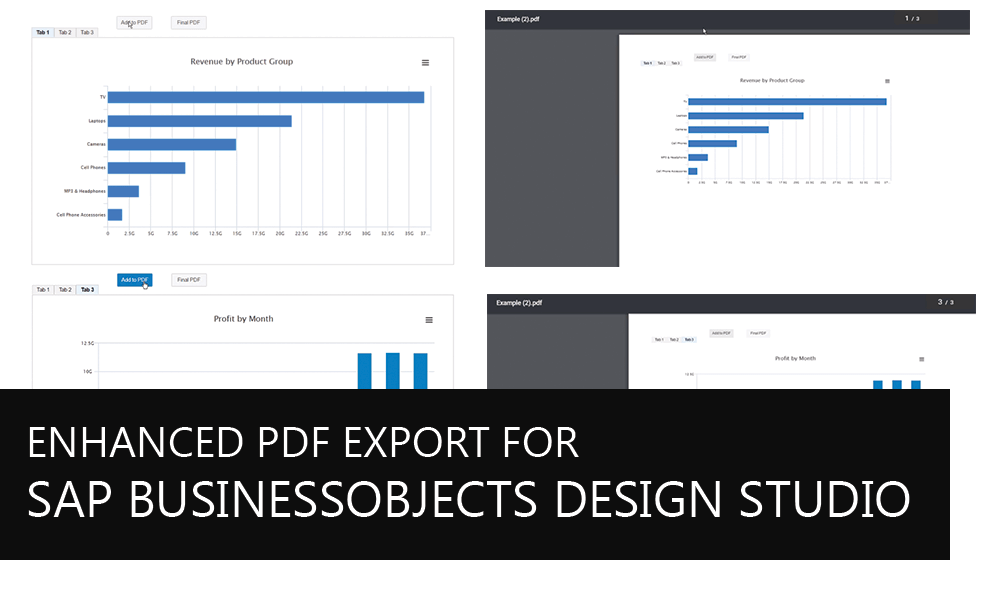
SAP BusinessObjects Design Studio is SAP’s leading product for professionally authored dashboards and applications. Even though all these dashboards and applications are available, either browser-based or on your mobile device (iPhone or iPad), a lot of customers are...
Innovative UX using SAP Design Studio

Innovative UX using SAP Design Studio

by Bhupinder Singh | Sep 29, 2021 | Custom Add-Ons, SAP BusinessObjects Design Studio, VBX Product Extensions

In many organizations , dashboards translate into layouts with a lot of charts and tables. We have shown a use case where Occupation Safety and Health Administration Standard (OSHA) metrics has been superimposed on a visual to make them expressive and visually...
Conditional Formatting on a Map in SAP Design Studio

Conditional Formatting on a Map in SAP Design Studio

by Lumel | Sep 29, 2021 | Business Intelligence, Custom Component, Data Discovery, SAP BusinessObjects Design Studio, VBX Geo Mapping, VBX Product Extensions

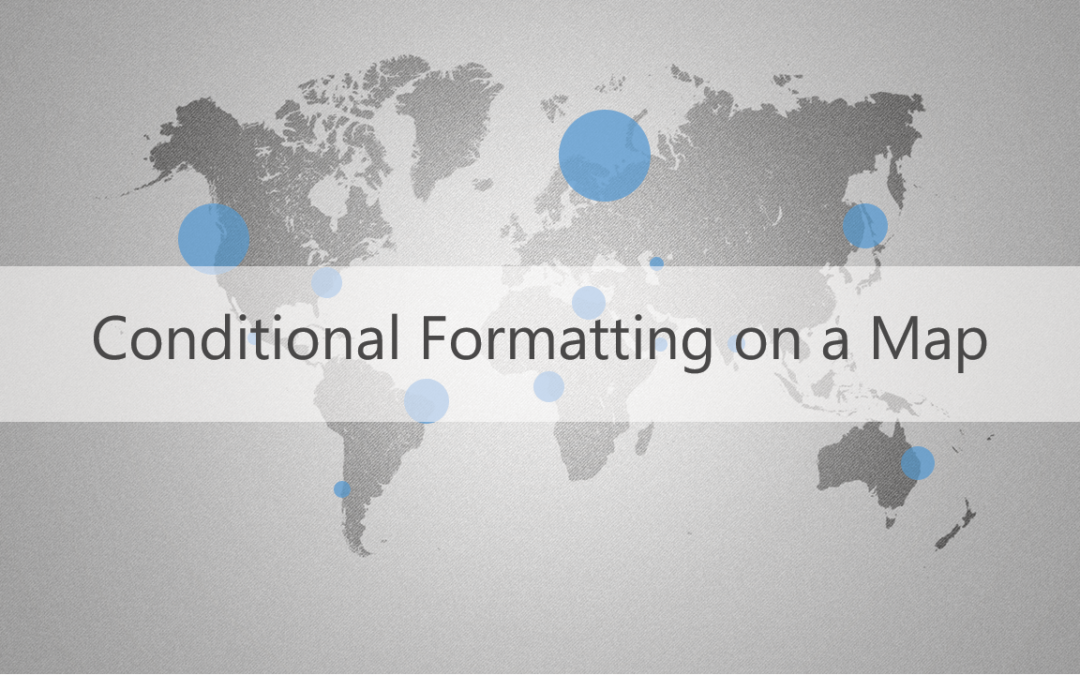
This is part of the VBX Geo Mapping Capabilities blog series. Conditional Formatting is an interesting feature. It’s flexible and is a great way to easily visualize data within a range that meets some criteria. Maps, on the other hand, is a data...
« Older Entries
Next Entries »

Categories

  • Advanced
  • Business Intelligence
  • Custom Add-Ons
  • Custom Component
  • Dashboards
  • Data Discovery
  • Extensions
  • General
  • Lumira 2.0
  • Lumira 2.2
  • SAP BusinessObjects
  • SAP BusinessObjects Design Studio
  • SAP Lumira
  • SAP Lumira Designer
  • Tips and Tricks
  • Tips and Tricks
  • Tooltip and Data Label Customization
  • Top Business Intelligence blog 2017
  • Uncategorized
  • VBX Advanced Table
  • VBX Geo Mapping
  • VBX Product Extensions
  • Xcelsius

Components

  • Utilities
  • Specialty
  • Selectors
  • Maps
  • Charts

Pricing

  • Pricing

Resources

  • Videos
  • Gallery
  • FAQ
  • Downloads
  • Case Studies
  • Attributions
  • Webinars

Company

  • Privacy Policy
  • What’s Included

  Follow Us


Copyright © Lumel Technologies Inc.

Contact Us

5920 Windhaven Pkwy, #130
Plano TX 75093